
The May non-farm payrolls report was broadly as expected: printing at +175k (mkt 163k), with offsetting revisions worth a net 12k due to a 16k decrease in the April estimate (to 149k) and a 4k increase in the March estimate (to 142k). The unemployment rate ticked up 10bps to 7.6%, as the participation rate ticked up 10bps to 63.4%.
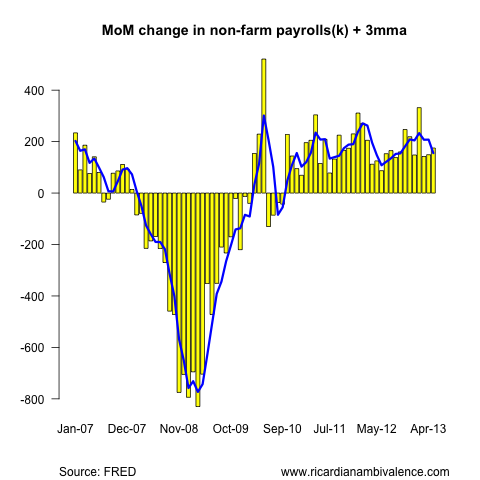
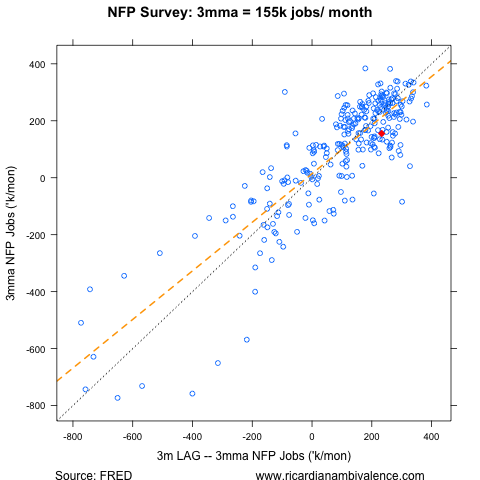
Everything is measured with noise, so it’s worth noting that the 3mma fell 52k to 155k: as the addition of a +175k in May did not make up for the monster +332k result in Feb falling out.
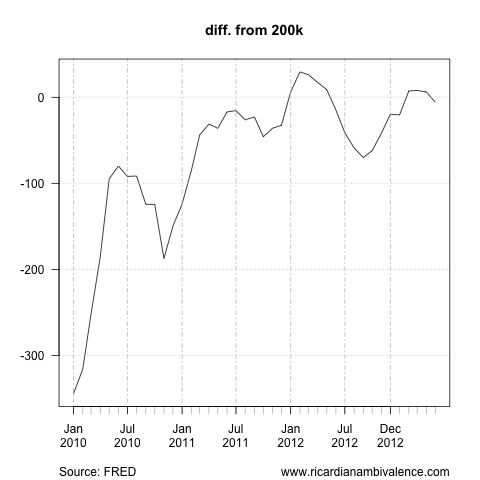
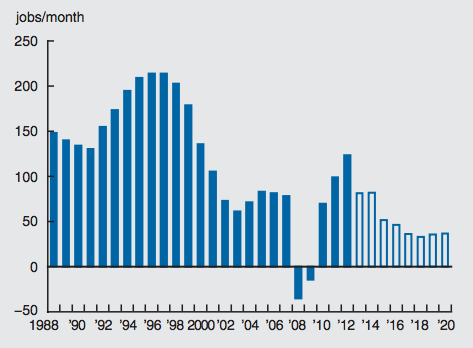
My judgement had been that the Fed would taper when NFP jobs growth was sustained above 200k for six months. We had three months of that to April, however we have dropped back a bit (to 194k) in May. Still, we are in the ball park, and revisions could easily get us back there.
The May estimate looks a little low. The prior 3m average suggests that we ought to be seeing slightly stronger employment growth. Perhaps this is the consequence of the sequestration — meaning that we would be enjoying payrolls jobs growth of ~200k/m if fiscal policy had not tightened so much in Q1.
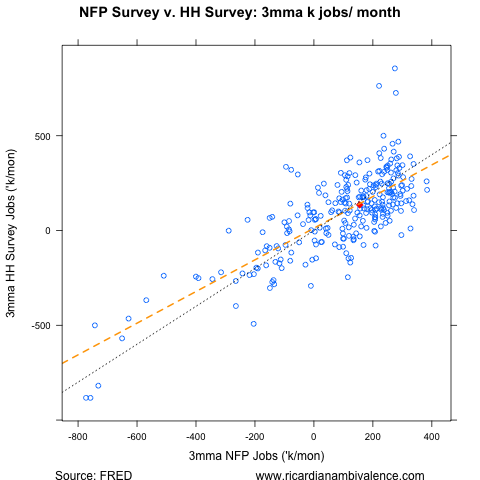
The separate household survey reported employment growth of 319k (following +293k and -206k). It’s normal for this survey to be volatile: the 3m average (~135k) is around where you’d expect given the growth of non-farm payrolls.
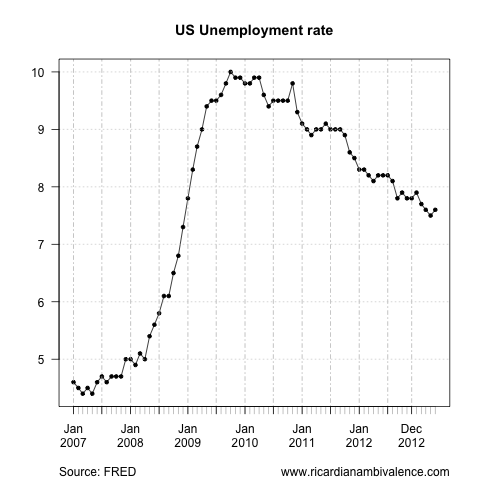
As I noted above, the unemployment rate ticked up 10bps to 7.6% — which is in the bounds of unchanged (the BLS described it as ‘essentially unchanged’). I don’t think there’s much information in this development — the trend remains down.
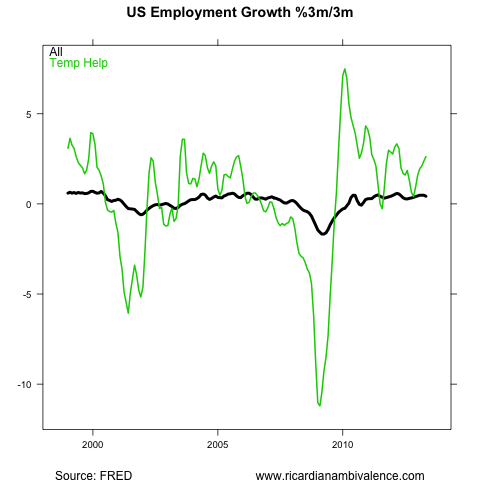
The details of the report are fairly upbeat — at least for the service sector. Temporary help employment, which is often a lead on more permanent hiring, continues to pick up.
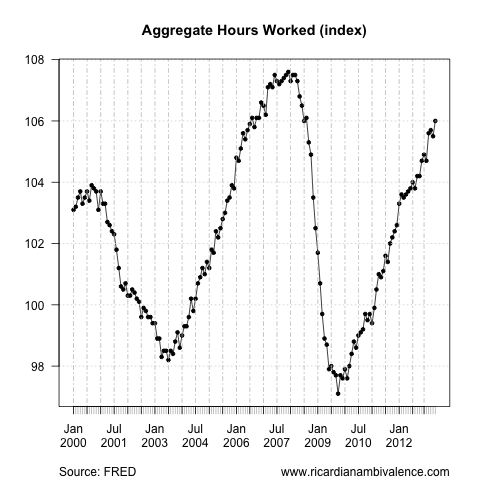
The work-week was as expected, at 34.5 hours — combined with the employment growth this was sufficient to lead to a significant boost to total hours worked.
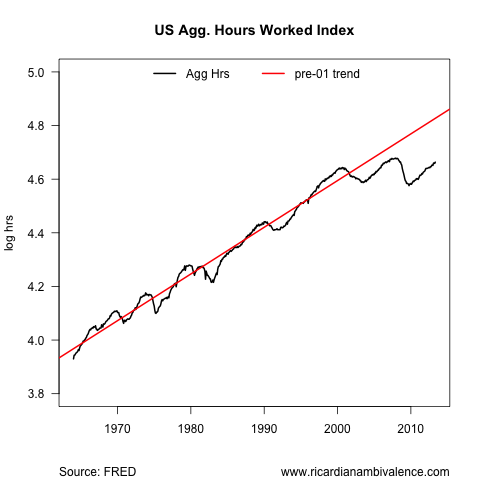
Thanks to the combination of firm hours worked, and decent employment growth, we are finally closing the hours worked trend-line (not that it’s sure we’re going back there — see below).
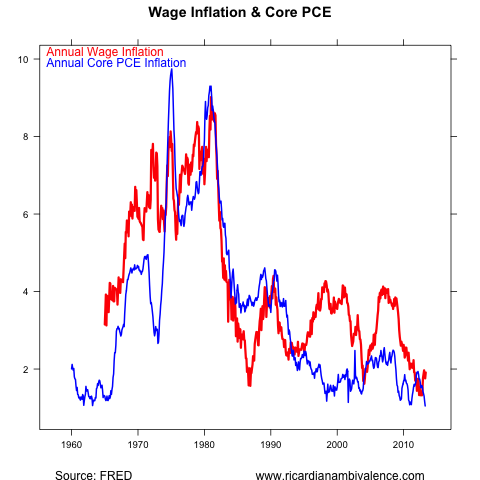
Hourly earnings were weaker than expected (flat v. mkt 0.2%m/m) — however the medium term story is one of (finally) rising wage pressure. You are unlikely to have a sustained deflation problem with wages rising ~2%y/y — and my guess is that the above chart (or something like it) is the reason the Fed thinks the currently low core PCE numbers are temporary.
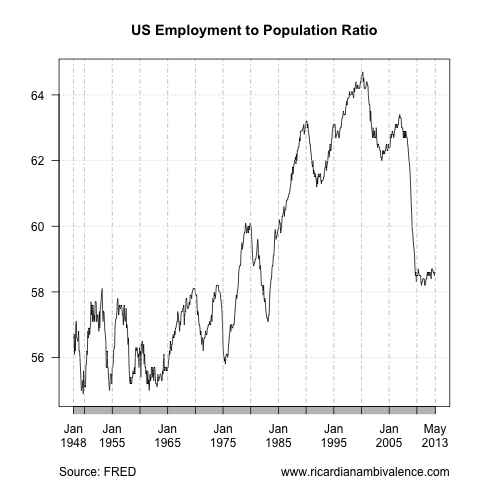
Of course, the total non-recovery of the employment to population ratio remains the key ‘problem’ with any upbeat story … this was unchanged at 58.6% in May (up only 40bps from the 58.2% cycle-low).
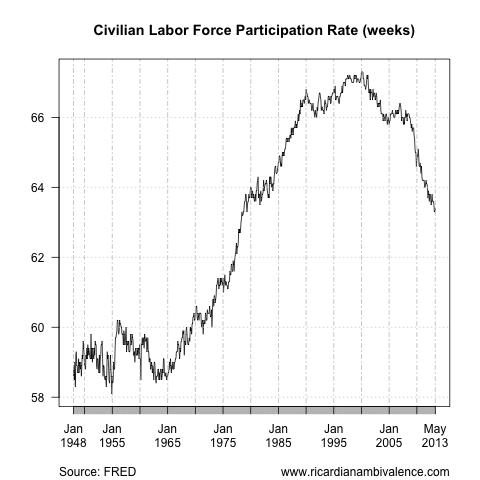
This non-recovery is due, in large measure, to the decline in the participation rate. I had been of the view that this was mostly cyclical, and that a true recovery would mean an increase to ~65% … however this judgement has been challenged by new Fed research.
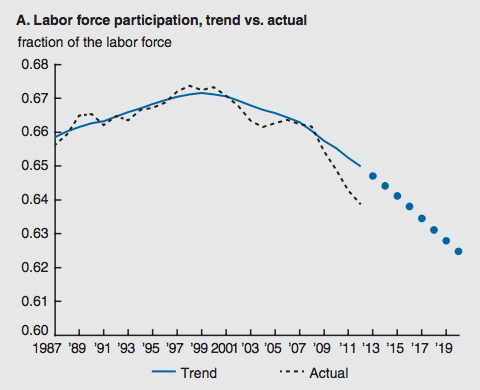
The Chicago Fed’s latest economic letter argues that the decline of the participation rate is mostly demographic / structural. While ~65% would be appropriate now, the participation rate is trending down due to demographic factors.
As a result, they find that so-called trend jobs growth (jobs growth required to stabilise the unemployment rate) is falling — and is likely to be ~80k / month.
If this is the case, the US economy is presently growing well above trend and tightening cannot be far away. I’m not 100% convinced, however it at least explains why the conversation has turned to tapering.

In just the first 5 to 10 minutes after the jobs number, we had 1% swing in gold, 1% swing in S&P 500, 140 pip swing in USDJPY, and a 345 point swing in Nikkei futures. If I was at the fed right now, I would worry much more about financial stability over the PCE. If only talking about ‘tapering’ (a small reduction in the monthly *expansion* of the balance sheet some months away) produces this result, we better get ready for huge volatility when the balance sheet expansion actually stops!
good summary. Have a look at what Menzies Chin says at econbrowser . He is before you on Around the traps in US section.
What do you think?
I like MC in general, and am sympathetic to his (Lazear’s) view that it is more cyclical than structural. I guess MC gets to be more agnostic on this stuff … As a fed / market focused guy, i feel the need to understand the fed, and so gave greater weight to the possibility that the PR drop is structural.
Bill Evans’ Friday column in Bus Spec said that the Fed believes most of the fall in th US participation rate is cyclical, but gave no evidence: http://www.businessspectator.com.au/article/2013/6/7/interest-rates/weekend-economist-dollar-direction-determinant
Any thoughts?
they have been publishing on this a bit — i linked to a chicago fed paper in my non-farm payrolls note that makes basically this claim. other regional feds have done similar work.
Sorry I thought you said the Fed research is saying the decline is mostly structural. (I can’t look at the linked paper at the moment as I’m download constrained.)
sorry, that was all my mis-read … yep, the emerging consensus in the US is that the drop in participation is mostly STRUCTURAL …. not cyclical. I haven’t looked closely enough at the data to have a firm view. i guess the equity market bounce is putting retirement back in reach for some, which i suppose might explain the timing of the drop.