
I’m generally not a fan of placing emphasis on single data releases — the noise is simply too large — however current events means that there’s more signal than usual in these releases.
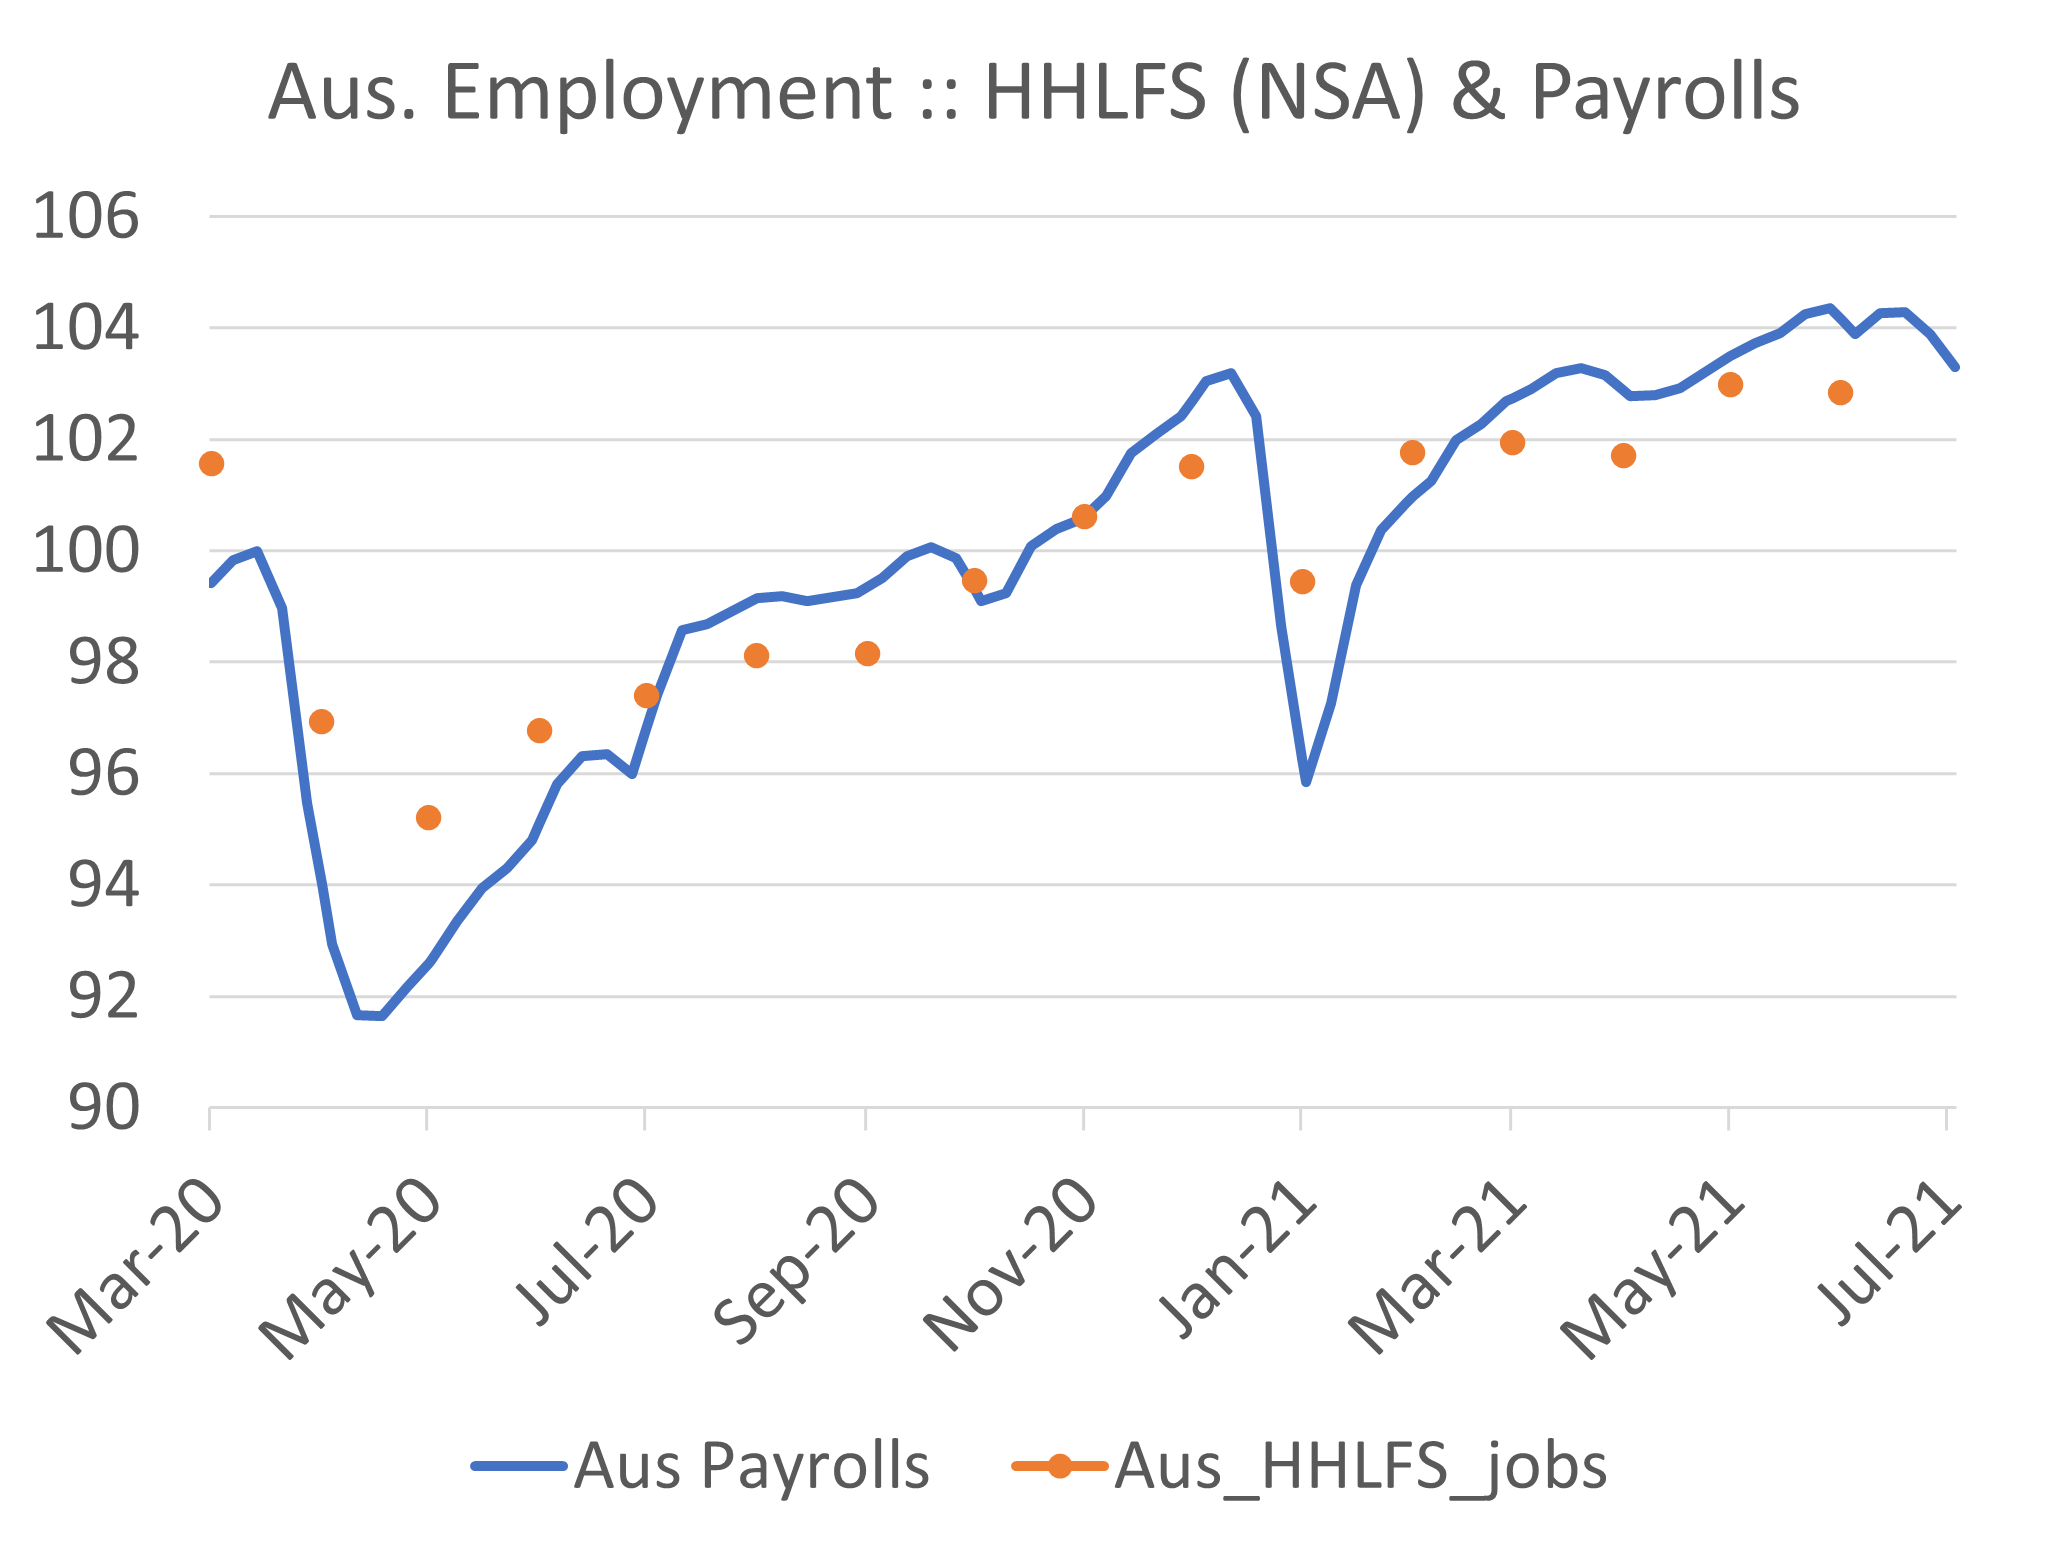
The ABS weekly payroll estimate for the reference week of 3 July confirms that jobs were lost everywhere in June. Total employment declined 1% between 19 June and 3 July. While job losses were greatest where there were lockdowns, payroll jobs declined in every region, with the single exception of regional Tasmania. Nationwide employment number looks to have declined by about 50bp, which is 10x the normal seasonal decline in July (recall that the Payrolls data is not seasonally adjusted whereas the HHLFS is seasonally adjusted). This should deliver a headline seasonally adjusted employment decline of around -50k for the July jobs report (on 19 August).
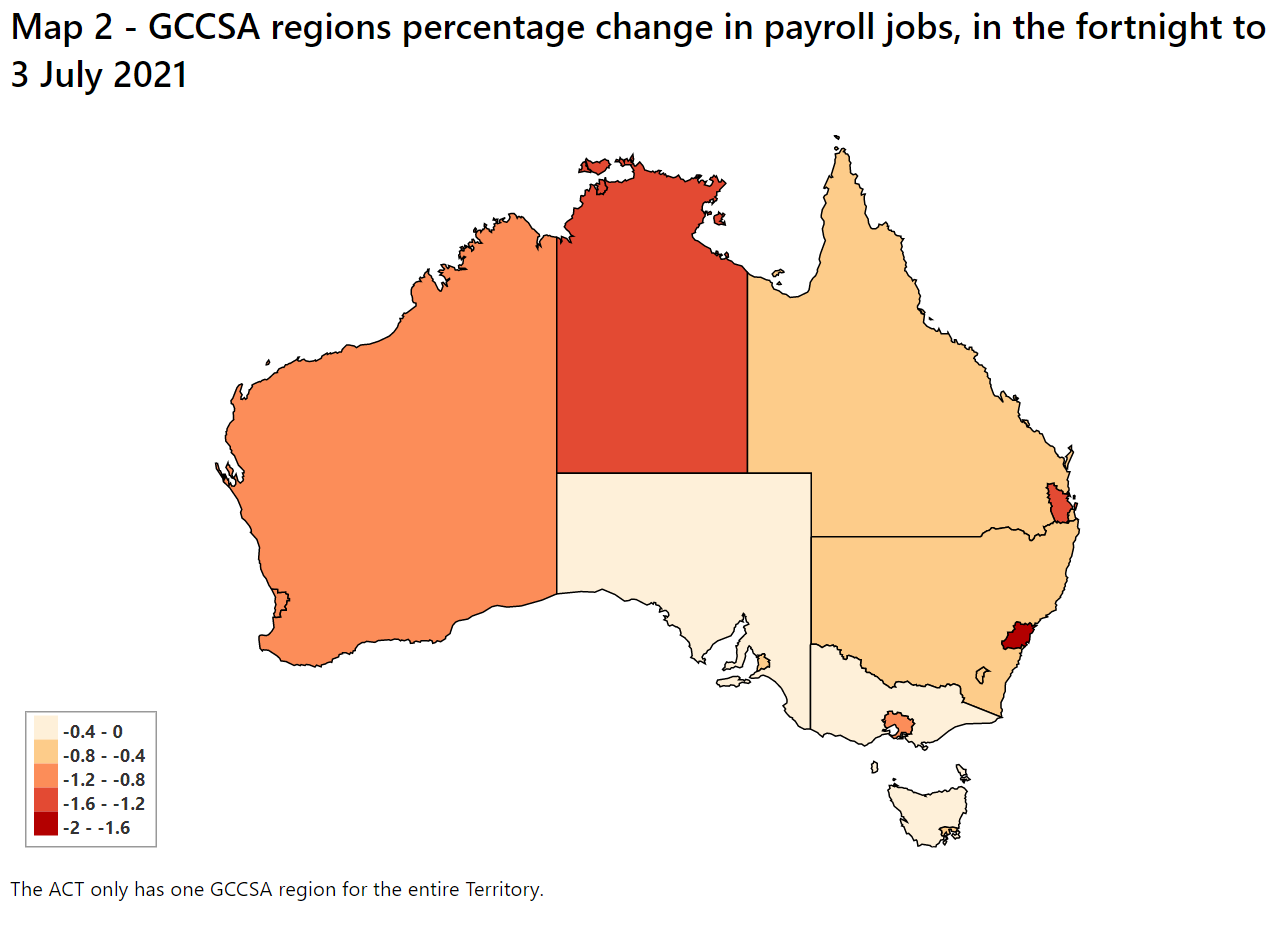
The ABS has published great new data that shows employment split between capital cities and regional areas (above chart). This shows that the job losses were focused on the capital cities, which is where the lockdowns occurred. That makes sense.
In NSW, employment had declined ~2% from the high-water-mark to 3 July. Given the extension and hardening of lockdowns since that time it seems reasonable to expect a larger decline over July. NSW is a little over 30% of national employment (greater Sydney is about 75% of that, or just below 25% of Australian Jobs).

While job losses to date are minor compared to the job losses in Q2’20, this is an important data point for two reasons. Firstly, it helps to answer the question about firm behavior. There was a reasonable argument that firms may hoard labour given the rapid recovery, high levels of job advertisements / vacancies, and reported difficulties finding skilled labour. That doesn’t seem to be happening. Second, it helps us gauge prospective job losses.
My guesstimate is that we’re less than half way done with job losses in NSW. Assuming this stage 4 lockdown ends in September employment is likely to decline by around 4%. Maybe more.
Modelling released at the start of this week suggested that it’d take about six weeks to get the case count back to 5 per day. So we’d exit stage 4 lockdowns in early September.
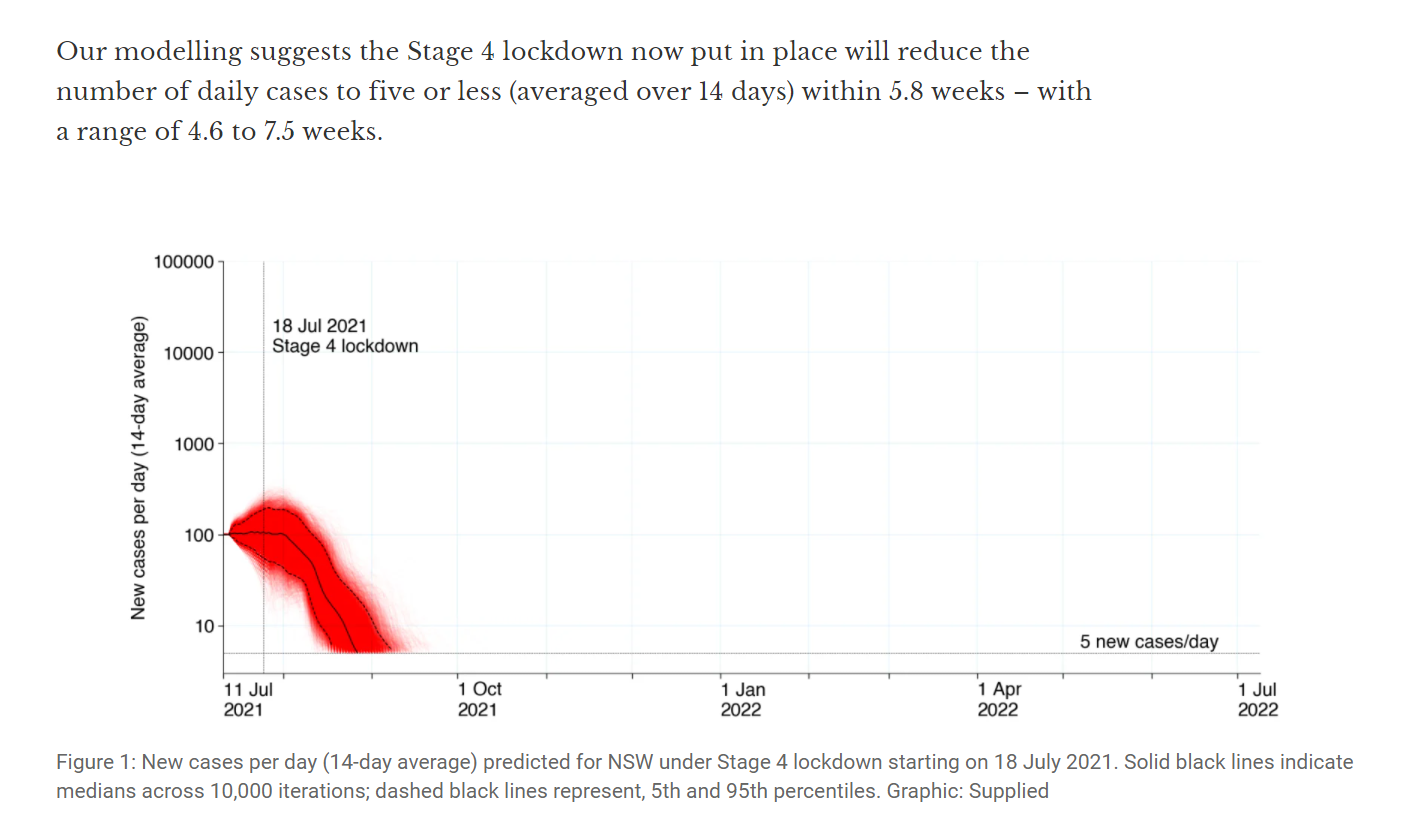
Since that time, “Daily NSW COVID-19 cases in the community while infectious” have increased from 21 to 48. While this may not be all bad news, as it very likely reflects increased testing-rates, my guess is that if Prof Blakely re-ran the model the median estimate for the stage-4 lockdown would be a bit longer.

Finally, the release of June preliminary retail sales data yesterday adds a lot of information for estimates of Q2 GDP, and allows us to make some more informed guesses about Q3 consumption and hence Q3 GDP.
The 1.8%m/m decline in June (mostly due to lockdowns in Victoria and NSW, which respectively contracted by 3.5%mom and 2%mom) puts Q2’21 nominal retail sales around 1.5%m/m and likely places Q2’21 real retail sales at ~1%qoq. This is a solid start to Q2 GDP, and it puts an outcome of around 1.5%qoq within reach (this is basically the upside scenario in the May SOMP). That’s why the RBA decided to taper QE on 6 July.
The shape of Q2, and in particular the dip in June, is a weak setup for Q3. It remains to be seen if people will spend like they did in Q2’20 during the present lockdown. I doubt it.
Most people I know purchased a lot of stuff they did not use in 2020 (so the shed is already full). And the nature of Government support has changed.
The nature of fiscal support may change — retailers have been asking for JobKeeper 3.0, as they report that the shift to online spending this time has been weaker — but unless and until policy changes, the economic consequences of these lockdowns seems likely to be harsher than those we had in 2020.
