
Bernanke gave a speech on long term rates on 1 March.

In it, he provided the above forecast track for US 10yrs. I’ll be surprised if we get back to > 4% 10yr yields this decade.
Follow-up: as manny pointed out in the comments, the error bars on the model forecasts are wide. Anyone who has done financial or economic forecasting would be familiar this difficulty …
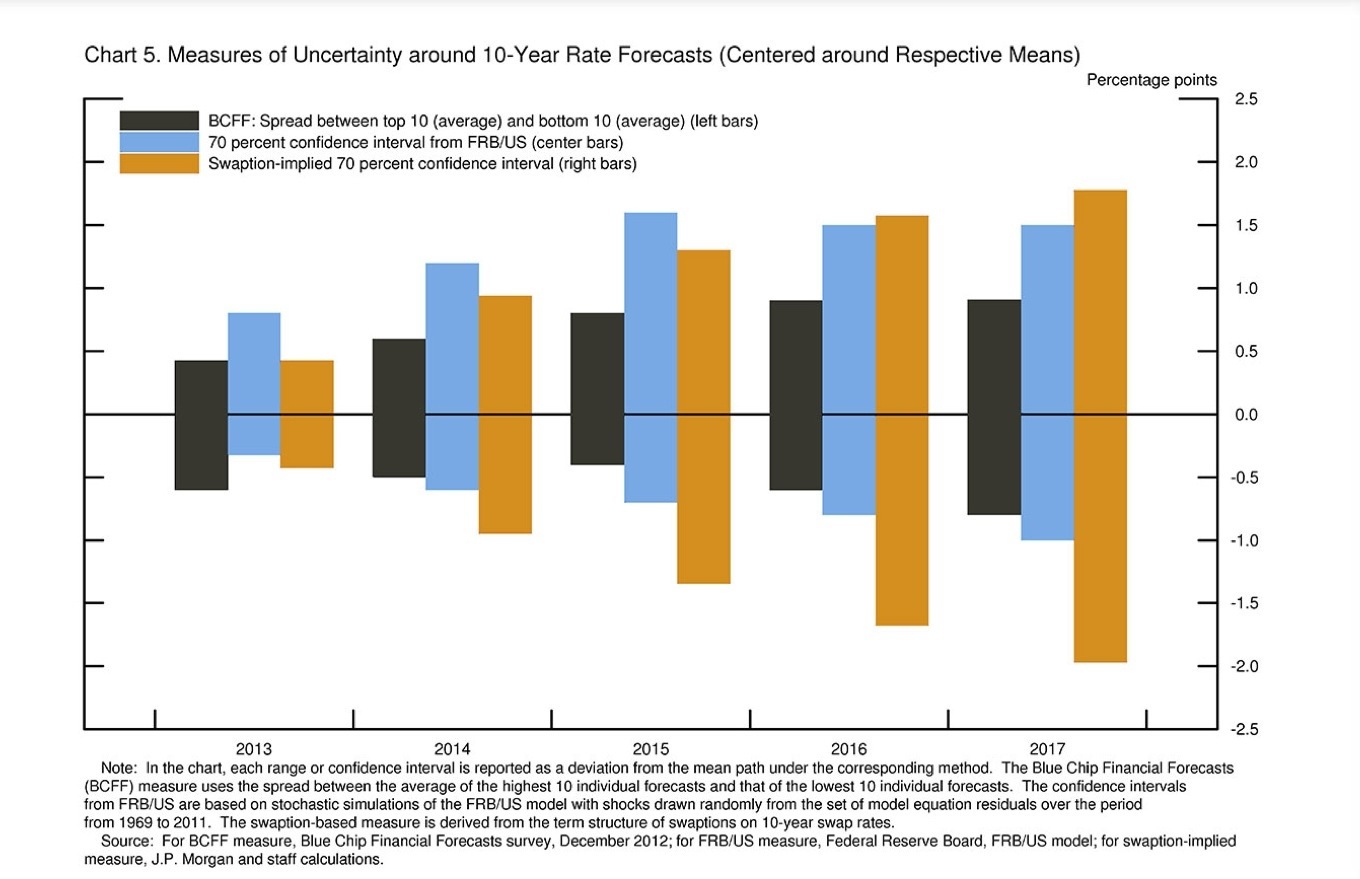
Except apparently the respondents to the blue chip survey — who in aggregate have less dispersion in their forecasts than any either the Fed or the Swaption market.
Overconfidence? Or are the foolish traders and monetary policy makers deaf to their wisdom?
More seriously, i think that the term structure chart below is very interesting.
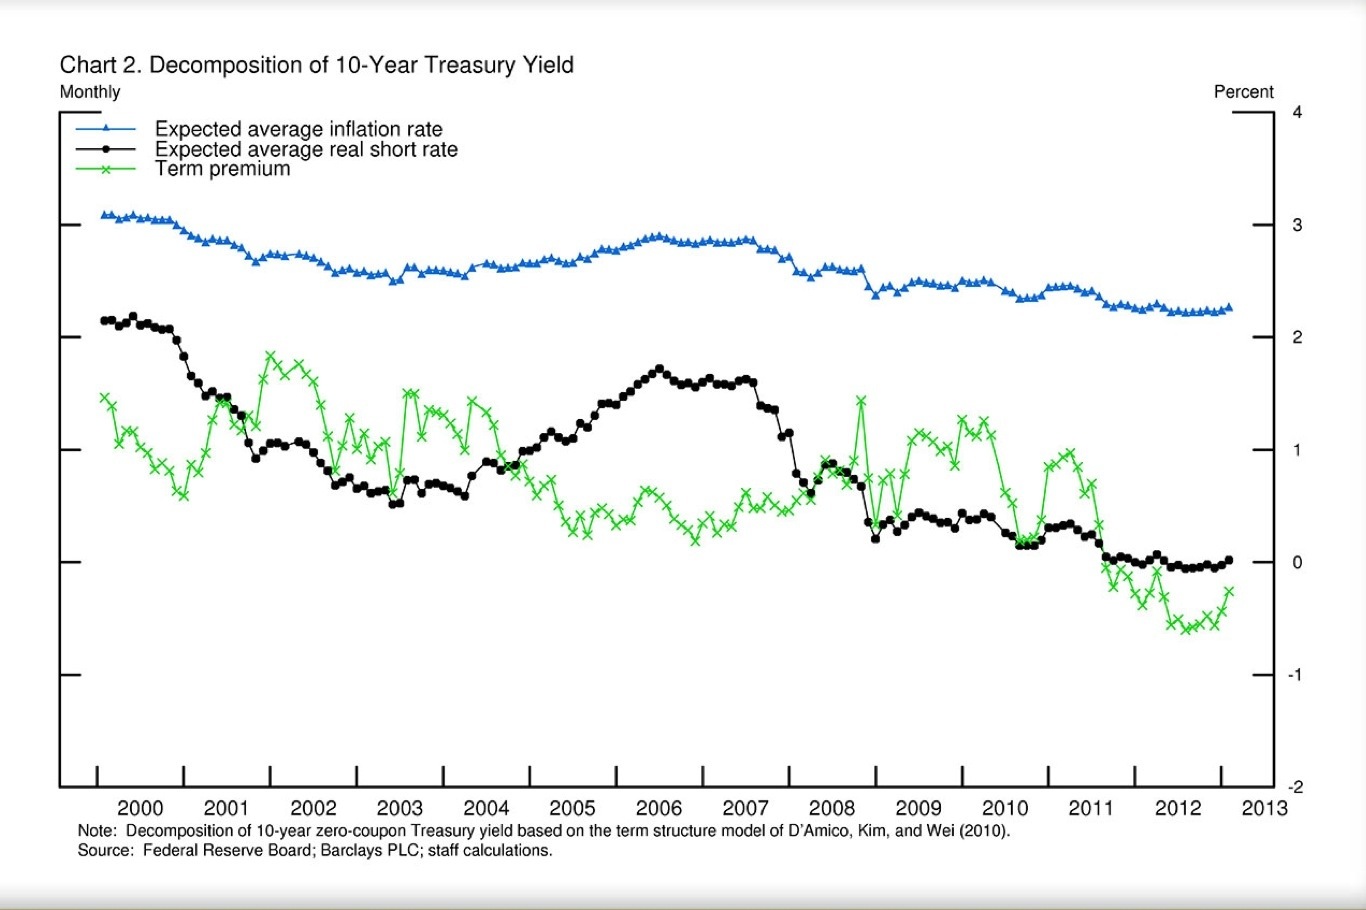
You can see that inflation compensation and real returns have been compressed by the weak economy, and that the Fed has squeezed the term until it is negative via their balance sheet expansion led move into the long term treasury market. If / when the Fed stops buying bonds, it is that term premium that is going to move – you’d want the economy to be pretty robust before letting that rip.

The error bars were pretty big. See hamiltons post.