
With all the focus (and wound-licking) following the RBA, the trade data is a chance of being missed. This would be a mistake, for the trade data is telling you why the AUD is unlikely to break materially lower.
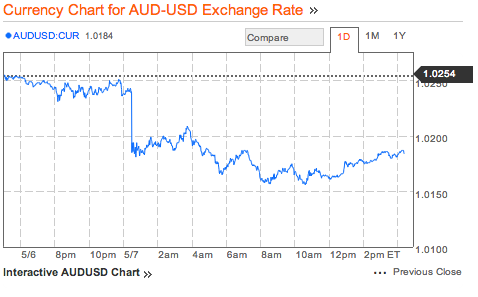 Sure, it got a bit wounded following the RBA’s move to 2.75%, but all told the move down has been modest given that the cut was only 50% priced before the meeting.
To see why, first think about what the currency does: it moves up and down to make sure that the current account deficit (the fact we buy more stuff from the rest of the world than we sell) is perfectly funded by the capital account (the fact that the rest of the world invests more money into AUD, than we invest into them).
So what does the trade data tell us? It is that the value of exports is growing despite the headline commodity price weakness. This is the sign that we are in ‘stage 3’ of the mining boom.
This might not be so good for employment (or tax receipts) but it is going to be good for measured activity (both nominal and real: these export charts are all nominal). As a result of a higher value of exports, we will not need to bring as much money in via sales of Australian financial assets — and all things equal, this means a stronger AUD.
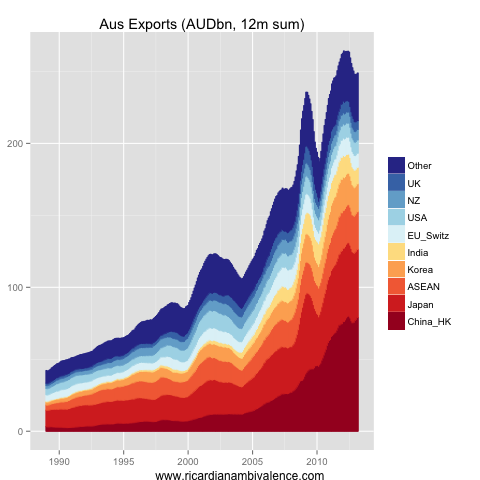
The total value of exports was ~249bn for the year to March 2013. This is down 15bn (or ~5%) from the peak in Feb 2012, however the encouraging thing is that the total value of exports is rising again despite headline price weakness — this suggests a strong volume response. In 3m YoY terms, total values are +1.5%yoy.

Growth in the value of exports (measured in 3m YoY terms) has been led by growth of exports to China (+19% 3m yoy). The level of Chinese imports (12m rolling sum) is back near the record high of ~80bn that was reached in mid 2012. The ASEAN region is also growing strongly (+7% 3m yoy) and is also back near the all time high.
Japan is recovering (-4% 3m yoy) as the stimulus policies of the Abe government work, which is a welcome counter to the weakness in India (-24% 3m yoy). Korea appears to be stabilising, after a period of sharply slowing growth (-9% 3m yoy).
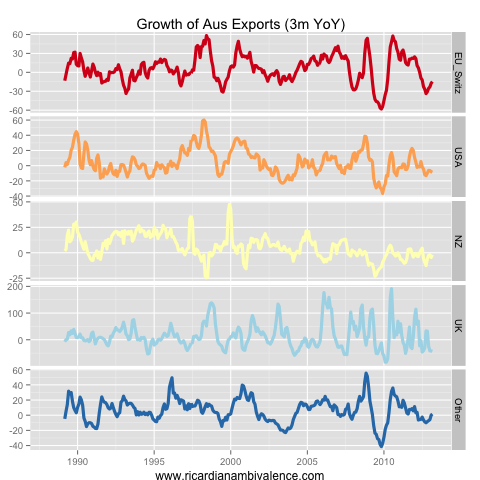
Even though European nations are not major Australian trading partners, in aggregate Europe is an important direct (and indirect) destination.
The weakness in the Euro area is clear from trade data: the value of exports to the region are down sharply (-15%). The situation in the UK is even more severe, with the value of exports to the UK having crashed by 43% compared with the first quarter of last year (there is possibly some irregular trade that has created this disturbance).
Overall, however, the value of exports is rising once again, led by growth in exports to China and the ASEAN region. It is doing so despite the strong AUD and weakness in commodity prices. All things equal that means the AUD can be a little stronger, as we do not need to discount AUD financial assets quite so much to get foreigners to buy them (= lend us money).
As phase 3 of the mining booms rolls on, i think we’ll see more of this. It is only a ‘divergence’ between export prices and the AUD if you don’t think about what links export prices and the AUD. The AUD should be buoyant in this phase, as the increase in export volumes compensates for price weakness and capital goods imports drop. Together, higher export values and reduced import values will tend to reduce the current account deficit and support the AUD.

There’s a material risk of oversupply in h2 should china’s (the only partner that really counts) demand not keep up with significantly expanded supply. then prices would come down hard. then AUD would sink. While it’s not hard to imagine scenarios that would put a dent on AUD , the upside looks quite limited with S&P and risk assets ripe for a correction. Also, if you were already buying at 1.03-04 more longs would be far too risky! And what if the Fed really stop asset purchases and jobs in the US pick up while we are facing the mining slow down? Are we at AUD peak and interest rate differential will flatten?
The interest rate differential isn’t the whole game — it is used in place of a variable that shows how attractive AUD assets are on a relative basis. The narrowing gap is a depressing factor, no doubt, but i think the narrowing trade gap is more important.
The terms of trade / export price to FX relationship is due to the fact that prices are a good guide to the future trade gap. When volumes move, the trade balance can improve despite a lower price, and this will lift the currency. At least, that is the theory.
I am thinking the range holds …
i think the overall economy is a more important factor, i can’t see a higher dollar from here if unemployment going to 6%. The RBA is quite clear, even more this time around, they’ll keep cutting if AUD does not realign. yesterday surplus was due to falling imports, which is a sign of other things going on in the economy
anyway we haven’t seen the AUD depreciate materially during trade deficits….
the range may hold for now but economic forces are pointing to the need of a lower IMO
For me the decline in imports is not at all due to economic weakness per se but due to the decline in resources investment (that is probably already underway). Therefore this trend is likely to intensify, suggesting if commodity prices can hold then trade will surprise to the upside for some time.
yes, the key is to see if commodity prices hold at these levels, as supply increase and new mines become operational. Chinese demand could fluctate too. We may have trade surpluses, but what about other variables such as unemployment?
Chinese trade data beat just now. April imports were 16.8%yoy v. Mkt 13.9%
Agreed. Capital imports are down. Resource exports are up … should be the trend for a while.
Go long miners then, better play than long AUD!
China is forced to do something about its laughable trade data
http://finance.yahoo.com/news/china-forced-something-laughable-trade-142815488.html
More details are emerging on the “strange” trade data:
RA, on different note, did you notice that ABS reported house prices as only increasing 0.1% in Q1-13, not matching what commercial providers are reporting? We know of the compositional differences between the various indexes, but it seems quite a large difference in this case.
I wonder if it’s due to the inability to “revise” old data when new transactions are incoming by RPData that we discussed before? ABS revised the Q4 quarter higher. so it would then seem to me that RPData is not really “real-time”? What do you think?
That makes sense to me — new data on q4 could lead to increases in the Q1 series. I have not read the technical docs in some time, so i may be wrong (Chris?). The yoy rates are close abs v rp.
excellent post. Keep them coming