
The AUDUSD has fallen out of bed over the last week or so — making a fool of my bullish bias at ~1.015 (see here to learn how I was fooled by exports).
It’s now trading ~98c down from ~1.02 a week back; ~1.03 two weeks back; and ~1.06 around five weeks ago.
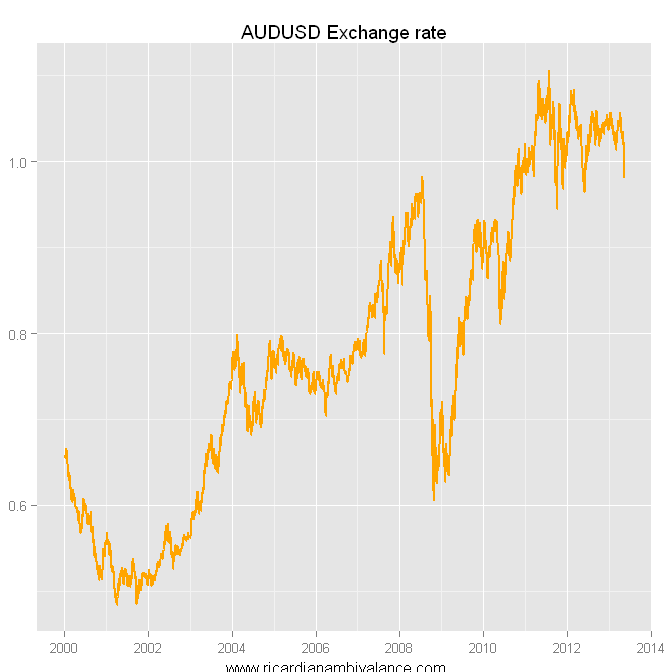
The broad trading range over the last three years has been ~0.9440 (4 Oct 2011) to 1.106 (1 Aug 2011), so it’s not yet clear that we have a breakout, but the short-term price action sure is sharp. Note also how close together the high and low are in time — when the AUD moves it always moves quickly.
Given this, my initial thought was that this sort of price action for the AUDUSD was typical, if seen only from time to time — the last decade or so has delivered a long rally, punctuated by sharp (and sometimes terrifying ) declines.
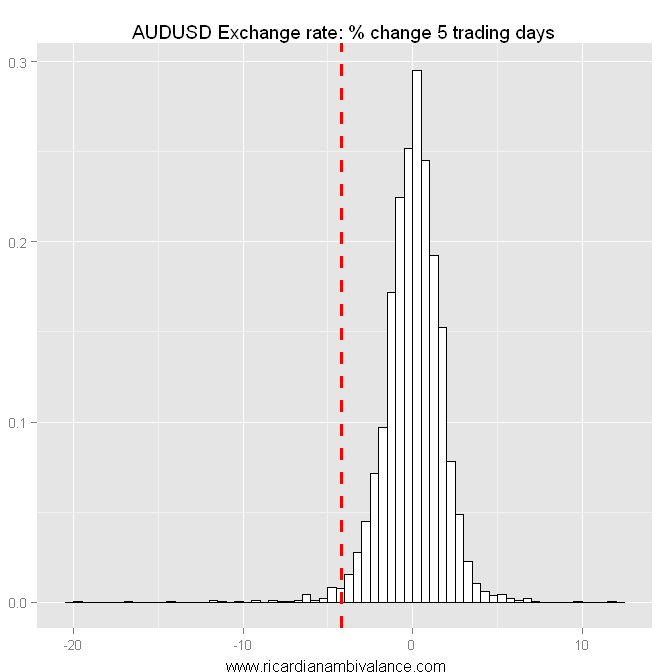
Checking the facts made things seem less clear — we are at the edge of what might be characterised as a ‘typical’ correction for the AUD. It could be something more. The drop over the last five trading days (week) has been ~4.2%, which is fairly unusual.
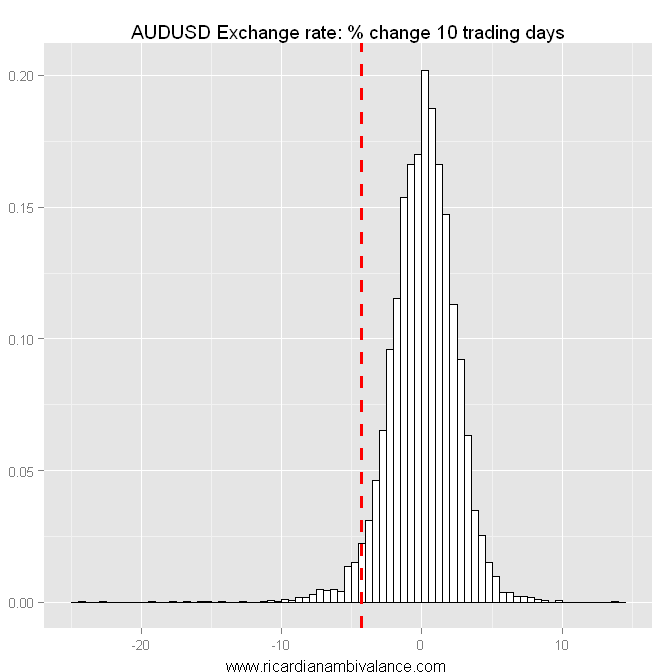
If we zoom out a little to a two-week frame things don’t look quite as unusual — the 10 trading day (two-week) decline has been ~4.3%. Yeah, that’s still odd … but it’s less scary.
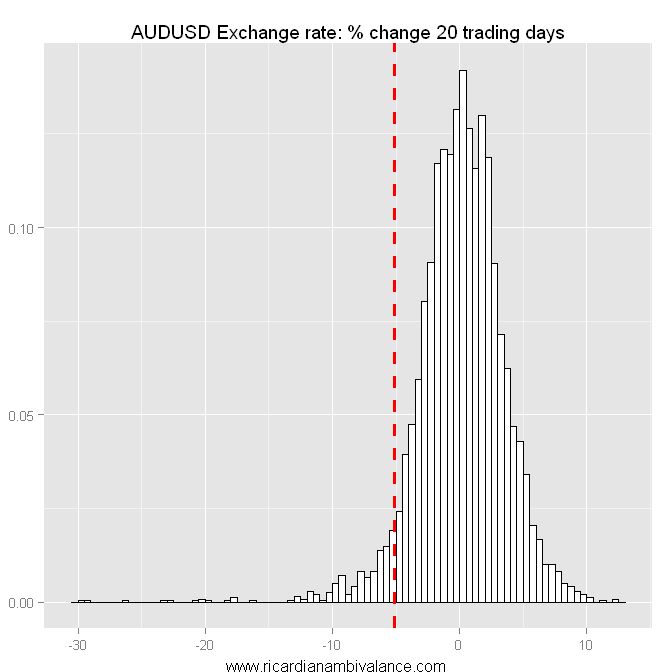
In FX, there is so much noise from flow that I think you need to look at monthly changes. On this basis, the decline (5.1%) is at the edge of normal — but not really that uncommon for a ‘correction’ phase.
Breathe out… Or maybe don’t: the five-week change is fairly extreme.
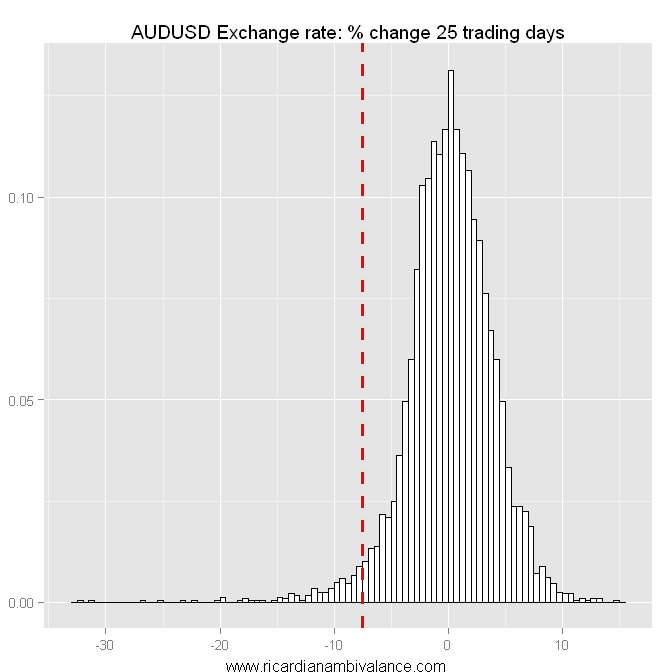
Going back five weeks takes us back to the day of the weak March Jobs report (jobs down 36k v. mkt -7.5k; unemployment rate +20bps to 5.6% v. mkt 5.4%). It is also prior to the low CPI and the rate cut. Over this period, the AUD is down ~7.5%, which is indeed unusual.
I think I’m going to sit this one out just now — but I’m a dip buyer around 96.70 (support in both the June’12 and Nov’11 AUDUSD corrections).

Most of those recent large rapid falls were fairly sudden ‘risk-off’ events. Here it seems it’s about USD (and economy) bullishness. Not sure if that maybe means the AUD correction will be shallower in the short to medium term than in under standard risk-off conditions.
Yeah, this move is different in that way. It may mean that it doesn’t bounce — or may mean that the move is more limited. i am not sure yet. Over to you Bernanke!
this one is a strange one, it’s happening while the S&P 500 is at record high, the AUD seems out of favor and it’s not bouncing back at all. it really feels like a change in positioning by the big guys. a lot of people got caught long and are panicking. it’s also combined with gold falling for the same reasons
BTW i ve been long USD for 18 months , missed on the carry but it is paying off finally. for some reason i am not taking profits yet because S&P is at record high and if it corrects then AUD will go lower too…. it’s a new situation it feels like a major shift in thinking by investors
Totally out of left field question: how do you get your URL stamped to the bottom of the chart?
No problem:
require(gridExtra)
## make ggplot chart called gp_HistDiff.10d
png(“AUDUSD_10d.png”) grid.arrange(gp_HistDiff.10d, sub = textGrob(‘www.ricardianambivalance.com’)) dev.off()
With the US stock markets bubbling along (new record high) and housing clearly start to recovering now, it’s going to be hard for Ben Bernanke to promise more liquidity even if inflation is not picking up. We are approaching the point where they will want to manage expectations and seriously start considering tapering QE, just on the base of asset prices, that’s why we are now starting to see higher share prices combined with a higher USD and lower gold on good economic data. Risk-on = higher USD , where it used to be risk-on = higher AUD. Tonight we got another demonstration of that. We’ll soon have a pause in this sell-off, as the AUD is oversold now, but the fundamentals seem to be structurally changed. The US economy seems to have found a bottom, the Australian economy may be close to a cycle top.