
There have been many false dawns in the US recovery, but — at risk of calling the next one — it looks like things are finally turning up in a meaningful way. Thus far the good news has been mostly confined to residential investment, and the weakness in Q4 growth (Q4 GDP growth was 0.1%q/q or 0.4% SAAR) and sequester had raised the possibility that fiscal policy would derail the recovery at a crucial moment.
Happily, the Feb PCE report suggests that the US consumer has decent enough momentum.
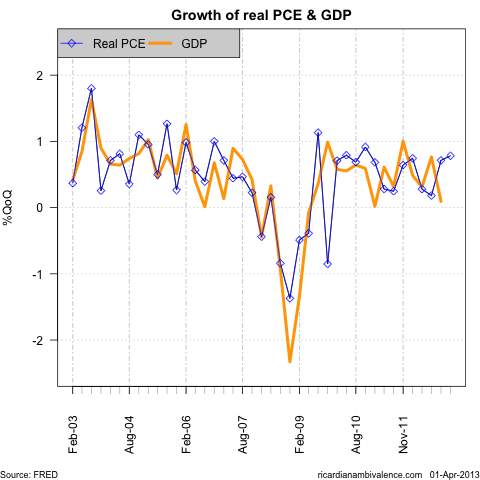
The Feb PCE report allows us to gauge the likely pace of consumption growth in Q1. The mid-quarter method (Q4 growth is Nov / Aug etc) shows that real PCE consumption accelerated modestly to ~0.8%q/q (~3.1% SAAR) in Q4, from ~0.7%q/q (~2.9% SAAR) in Q4’12.
This is encouraging as consumption is such a large part of the US economy that it’s pretty hard to have a recession when the consumer is strong. The strength of consumption puts a Q1’13 GDP print of ~3% SAAR in reach.
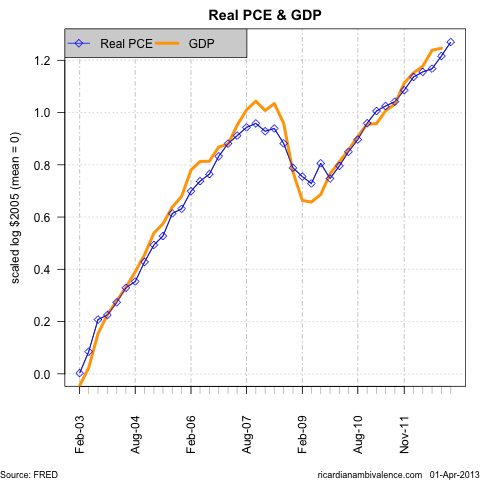
Looking at the levels data, the recent weakness in Q4 GDP appears to be more to do with the fact that the rest of the economy had run ahead of consumption in prior two quarters. GDP was ‘catching down’ to consumption in Q4, and consumption was ‘catching up’ in Q4 and Q1 — things look like they will be back in balance in Q2.
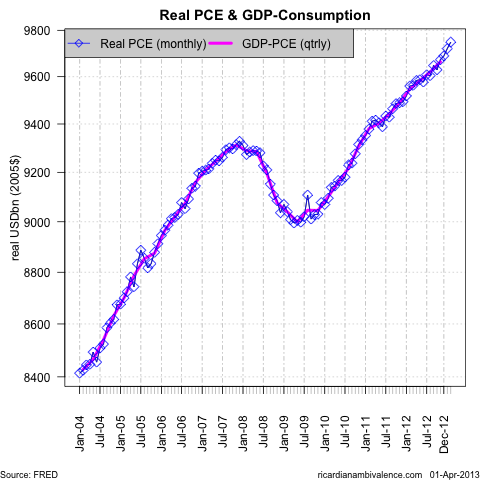
We can be fairly sure of this, as the monthly PCE report is basically the same thing as the quarterly series used in GDP (I’ve used the mid-quarter months to match against the quarterly data in the above chart). The quarterly data is a little smoother, but it’s not so different that we ought to doubt the apparent acceleration of consumption growth from November’12.
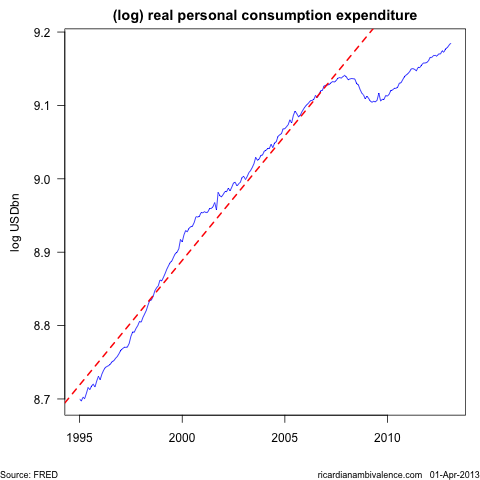
Of course, that’s not to say that that the US is anywhere near closing the yawning and massive output gap. Relative to the 1996-2008 trend, the ‘consumption-gap’ remains massive — which is why unemployment remains high.
There’s a case that the US was ‘over-consuming’ prior to the crash, and that Bernanke’s current efforts to discourage thrift are storing up trouble, however I think that (at minimum) it is okay to aim for growth at the old pace (so the gap at lest does not get any larger).
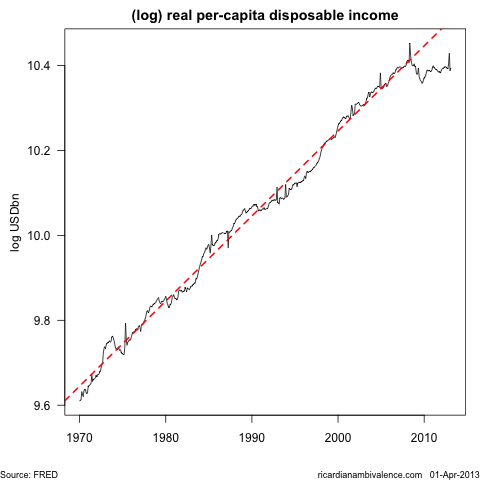
The hand-break on consumption remains the total non-recovery of real per capital (disposable) income. The average person has stood still since H2’06. 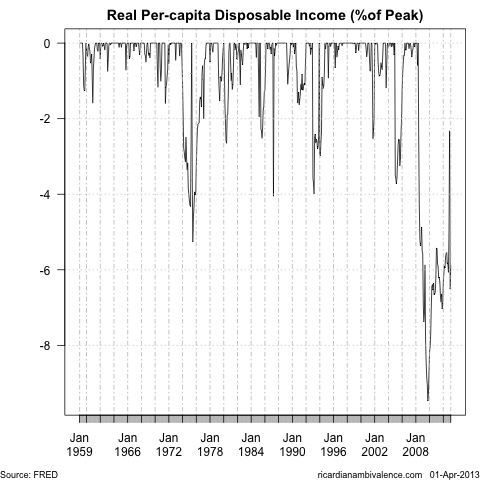
Despite 3.5 years of ‘recovery’ real disposable income remains almost 6% below the pre recession peak — and while this was a little inflated it’s ~2% below the pre GFC trend.
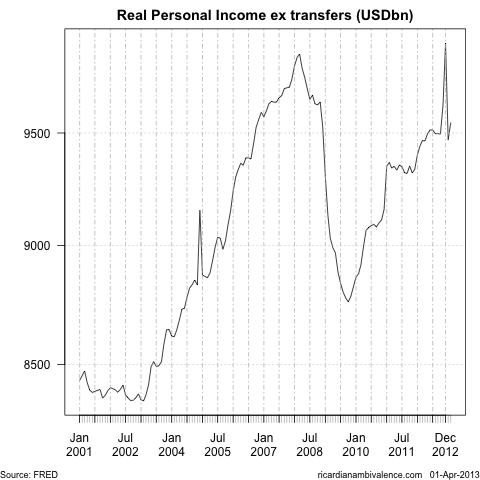
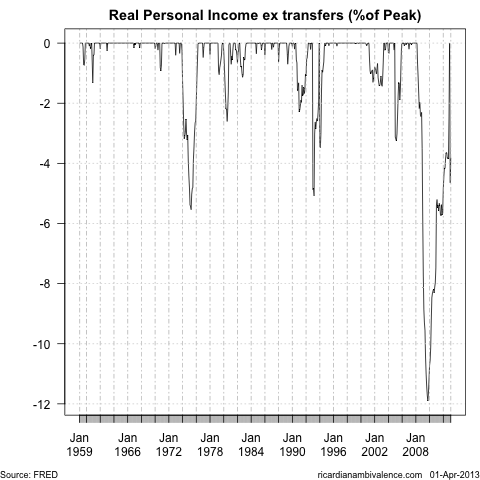
The weakness of the labour market, both in terms of employment and wages growth, is clearest from the weakness in real personal income excluding transfers. At ~9.55tn (SAAR) in February, aggregate income remain2 ~3.2% below the pre GFC peak.
By the way, I love the peaks in these charts — they show the power of incentives. The ~500bn (SAAR, or 40bn in the month) income spike in December was due to the bring forward of income to beat tax hikes — incentives clearly matter!
With savings rates already very low, there is little scope for consumption growth to be boosted by a falling saving rates — which means that we really need to see further improvements in income growth to be sure that the recent pick-up in consumption will be sustained. That seems plausible, as capital markets are offering very easy access to finance for firms that wish to invest.
To the extent that this is the result of policy, it seems likely to remain the case for some time. The inflation data suggests that there is plenty of scope for monetary policy to remain extremely easy.
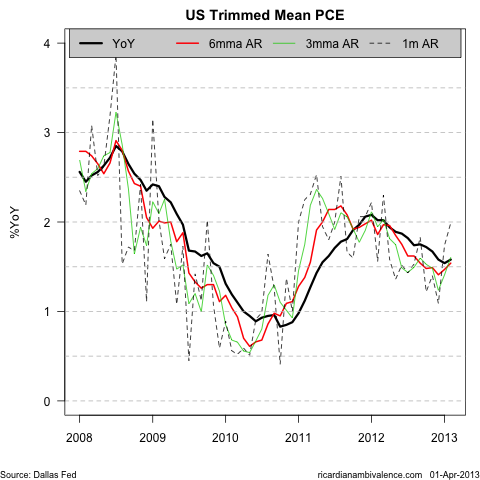
Inflation trends remain subdued, even including some evidence that there has been a very recent pick up. Trimmed mean PCE inflation in Feb was running ~2% SAAR, however the 6m average (the best measure) remains around a 1.5%y/y pace.
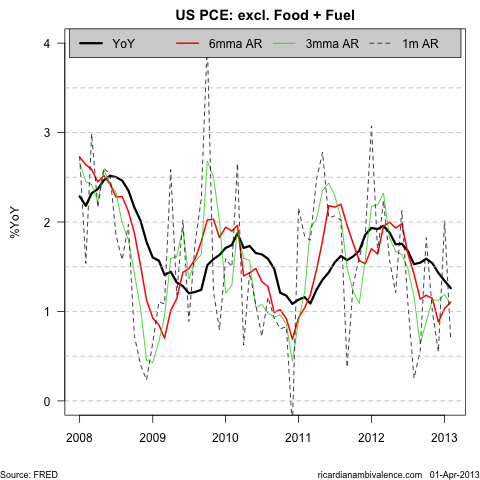
The more ‘American’ exclusion based measure the Fed prefers is even more subdued, showing little core inflation pressure: the Feb reading was arguably too low at ~0.7% SAAR (something Hilsenrath has noted). This took the annual pace of core inflation down to ~1.25%y/y (3m and 6m averages are ~1.1%y/y).
Similar inflation ‘dives’ led to QE1 in H1’09 and QE2 in H2’10 — and they make any move away from the current pace balance sheet expansion (85bn/m) seem unlikely. Pretty much everyone agrees that, in the long run, the only thing monetary policy can do it set the pace of inflation.
Right now, inflation is too low and unemployment is too high, so the case for tighter US monetary policy seems weak.

One comment
Comments are closed.