
With Australia’s 2013-14 budget only a day away, I figured it’s time to have a look at Australia relative to some comparable peers (note IMF data is made to be comparable across nations and so will not match up exactly with Australian Government data).
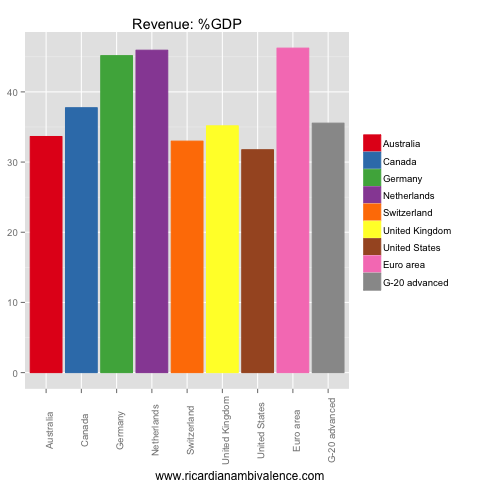
First off, let’s look at revenues (which Swan tells us have been ‘smashed with a sledgehammer’). Australian Governments collected ~33.6% of GDP in calendar year 2012. The US was lower, on 31.8%, and Switzerland collected 33%; the G20-advanced average was 35.5%. Note that the Euro area is the leader of the pack – despite the fact that revenue as a share of GDP typically drops when the economy is weak.

On the expenditure side, Australian Governments spent 36.6% of GDP in 2012. Only Switzerland was lower, at 32.7% of GDP. The G20-advanced average was 42.1%.
The Euro area is also top of the charts on spending, at ~50% of GDP — even after all the ‘austerity’ these remain high-taxing and high-spending governments. Perhaps their growth problem has something to do with the fact that the reward for work is diminished by high rates of tax, and that the 50% of GDP directed by the government is not well spent.
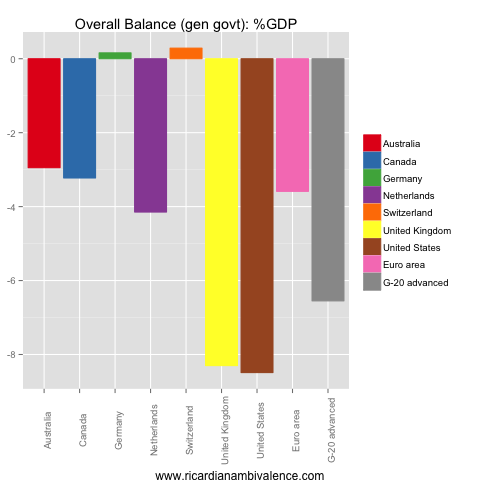
Spending more than you collect means you have a deficit, and so it was that Australian Governments ran an overall balance of -2.9% of GDP. This is the smallest of the deficits in the chart I included, but it’s a long way off the surplus in Germany (+0.2% of GDP) and Switzerland (+0.3% of GDP).

After adjusting for interest payments, the IMF calculates that Australia’s primary deficit was -2.5% of GDP. On this measure the Euro Area looks pretty good (but rates are high because they are a bad credit, so it’s also a junk stat). Here, Germany is the clear winner at +2.4% of GDP; Switzerland is in second place at 0.7% of GDP.

I am disappointed in this.
No context at all. no history, no discussion for example of nominal GDP in any of the countries .
Revenue as a % of GDP will always be larger in Europe than in Australia even in a recession!
You know that.
I am afraid this has been a wasted exercise.
It is a review of the facts. Feel free to add your own commentary and explanation of them – or contest their validity with reference to the IMF’s method.
Very good and pertinent post. “The 50% of GDP directed by the government is not well spent.” this is the key. Check most Northern European countries: big govt, big taxes, but money well spent as the govt actually works and the waste is minimal. Instead on concentrating on how much govt spends, let’s focus on where that money is going, how it is spent. We currently have the perfect economic conditions, with low unemployment, inflation in the target band, low interest rates, high commodities prices, a dollar that is demand… and the govt still can’t deliver a primary balance?!?! Then when? If revenue are low, get more revenues! Or cut tax concessions (negative gearing? family benefits? Superannuation?). If not now, then when? Is the high AUD the problem? Then lower it. Stop finding excuses. You can’t have it both ways. Is the economy strong or not? What if revenues keep going down? And they keep going on about this AAA rating, conveniently forgetting that Ireland had the same just few months before their banks went bankrupt. Who is going to repay the debt? Obviously future generations.
I will when you address some of mine which you completely ignored!
SSEC,
how would you attempt to lower the $A?
By the way the last thing we need is a more contractionary budget when Nominal GDP will be less than 3%!
For example, not running primary deficits would lower the AUD and allow the RBA to cut further.
2013: The last thing we need is a more contractionary budget when Nominal GDP will be less than 3%!
2014: The last thing we need is a more contractionary budget when the mining boom has just ended.
2015: The last thing we need is a more contractionary budget when the world economic recovery has just started but on weak footing.
2016: The last thing we need is a more contractionary budget while we have such a political turmoil in China.
2017: The last thing we need is a more contractionary budget while the Anow,UD has collapsed 30% now, and investment in Australia has dried up!
2018: The last thing we need is a more contractionary budget while house prices are coming down hard and unemployment is trending up!
2019: The last thing we need is a more contractionary budget, austerity is bad, remember Europe policies? We only have debt to GDP at 80% and we can print money anyway.
etc. etc.
The most interesting parts of Laurie Oakes’ interview with Treasurer Wayne Swan yesterday were the questions.
“…your budget speech last year – would you agree in retrospect it makes hilarious reading? You said for example, the deficit years of the Global Recession are behind us, the surplus years are here, now, that’ll have people laughing in the aisles…”
http://www.businessspectator.com.au/article/2013/5/13/politics/its-going-be-bad-week-wayne-swan
“Perhaps [the Euro area] growth problem has something to do with the fact that the reward for work is diminished by high rates of tax, and that the 50% of GDP directed by the government is not well spent.”
The evidence presented here does not provide any support for this statement. Over the long run, Euro area growth has been pretty similar to that in North America. Even if there were a case that Euro area spending had large efficiency costs, this is a structural rather than a cyclical issue. Their current woes are clearly macro-economic in origin.
No evidence was presented … It was a comment rather than a proof.
The “Euro area” does not exists as one entity. There are huge differences between countries and cultures. It is a known fact that a big chunk of govt spending is wasted every year in Southern European countries such as Italy, Spain, Greece, Portugal and even France. I am talking about entire hospitals started and never finished, roads leading to nowhere, govt dept in existence for 20 years and forgotten about it. It’s a system which is dying under its own bureaucracy and has been dying for years and years. But now they can’t print money anymore!
At the opposite side you have Norway, Denmark, Sweden, where govt is huge and taxes are big too, however, over there, it all magically works fine.
So it’s not the size of the debt but how it is spent and if it’s going to be sustainable. The higher the debt, the bigger the risk of malinvestement.
Yes! This is my exact view. It is the quality of spending that matters. But if you have high taxes (a disincentive to work) and high government spending (other people spending other people’s money) the probability of misallocated capital is very high.
Absolutely. You summarize it perfectly. And China will show that that is true, once again.
Their current woes are the result of inept fiscal policy over a generation or more. Debt went up in recessions, stabilised in recoveries, and then went up again in the next recession. They have now ‘hit the wall’. Even Germany looks awful once health and age related spending is taken into account.
Their welfare policies did not even work in a fiscal sense with firm population growth and firm asset price growth. Their economic policies always discouraged convergence to the ppf.
you provided no context, no history why? The graphs by themselves tell us nothing
the different budget positions mean bugger all. What are the different nominal GDP rates for example?
I did this recently examining Oz, NZ and Canada!
It was supposed to furnish a few facts ahead of the budget – nothing more or less.
while I am on a roll, we know the Commonwealth government will detract around 3/4 of a % pot from GDP growth. how does this compare to the other counties.
this is a much better measure of fiscal policy!!
except it didn’t for the reasons I outlined.
Having looked at both OECD and IMF data for Europe in most countries it declined in good times as it normally does.
Markets demanded for irrational reasons austerity measures in europe. The spreads closed when announced but widened when recession came as expected.
Eurostat: EU debt to gdp peaked at 74% in 1996, bottomed at 66% in 2007 after a massive boom, and is now 91%.
Europe is in heavy recession, their banks are undercapitalised, welfare and age related entitlement spending growth due to demographics are diabolical.
Are you seriously saying things were well managed until they were hit by a macro shock in 2007?
The capital position of the banks and demographics are all in the realm of things that ought to have been managed.
Markets demanded austerity because the idiot fiscal managers had breached no ponzie conditions – if you want to enter a gold standard (which is how the euro works) you accept that the adjustment will come from budgets as you cannot move NX via domestic monetary policy.
I somewhat agree with nottrampis.
The economies in different countries are very different and have different ‘steady states’ and therefore will have very different revenue and expenditure profiles. Taking a single year snapshot for a comparison ignores this and in my opinion is sort of a pointless exercise.
Would have been a more interesting post had you included a few more years of data.
On something ssec mentioned:
“The “Euro area” does not exists as one entity. There are huge differences between countries and cultures.”
While yes they are different, their currency is the same. Meaning when there is a downturn in parts of the eurozone this isn’t reflected in the value of the currency because the value of the currency is based on the whole eurozone. So in respect to a very important economic attribute they are essentially the same area because the value of the currency is very important.
I don’t understand what all the drama is about with people’s objections to these charts. Ricardo’s normative comments are pretty mild. It’s good to see a straightforward comparison of the recent data. Most of the figures commonly cited about Australia focus on the commonwealth and ignore the states, so I for one found the figures interesting despite the lack of context/history/geography, etc. It’s also notable that only Switzerland trumps Australia out of that group if one is interested in smaller government.
Thanks Rajat — that’s right, it was mostly a positive post. Just the facts — just trying to give the facts (Sure, i added my usual view on large govt / Europe, but you all already knew that!).