
There are some interesting stories in the October employment data.
The macro news isn’t great, but the good(ish) news is that the unemployment rate remained basically steady at 5.7% (in unrounded terms is was +0.1).
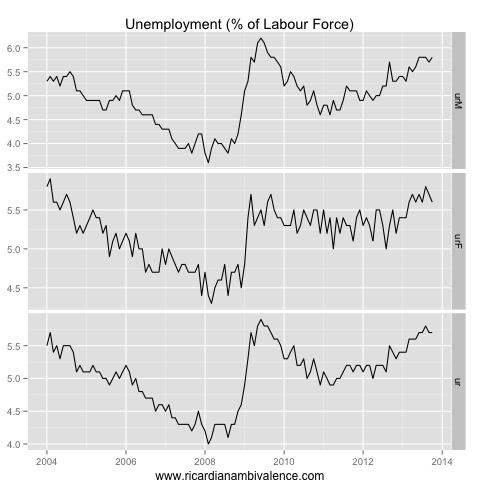
The male unemployment rate has been basically stable at ~5.8% for almost two quarters, and the female unemployment rate is back down to 5.6%, following a spike up to 5.8% two months back.
It is a well-known fact that the unemployment rate has been held down by a decline in labour force participation. I’m yet to make up my mind about this ‘story’.
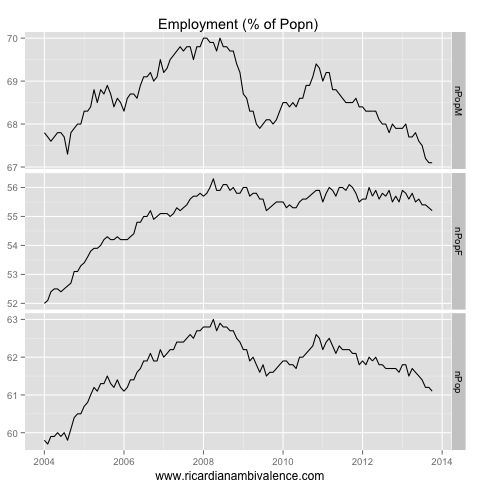
To recap — there has been a very sharp down-trend in the male employment to population ratio in the past three years. This is mostly explained by men dropping out of the labour force. This may reflect the fact that male industries are more challenged by the times (the manufacturing sector is struggling with the high AUD, and the mining sector is engaged in a cost-reduction drive), or it may be voluntary.
Getting this judgement right is key in assessing the probable amount of slack in the labour market.
There is a long-term change at work here — male labour force attachment has been trending down for the last thirty years …

A tempting story is that this is the result of men losing their way in a society with weaker stereo-types (and who doesn’t love a story about dead-beats?) — however the hours worked data provide some support for the ‘voluntary’ story.
 It has caught my attention that the drop in average male hours worked per month pretty closely mirrors the increase in average female hours worked per month.
Taking this story to the limit, one might argue that household production is being slowly altered to better reflect the desires of men and women. If this is indeed the explanation, we will probably see a further decrease in male labour force attachment and a further increase in female attachment.
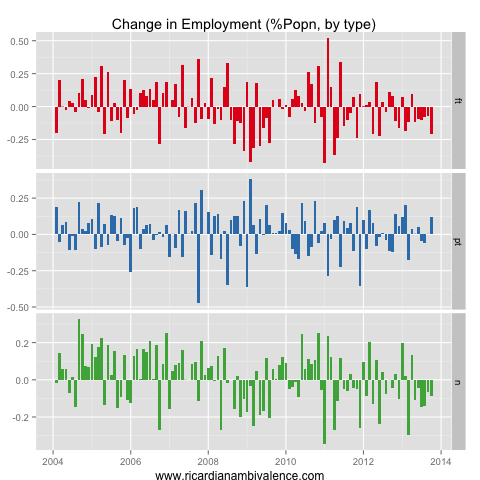
While we are on hours worked — this is where another good bit in the data can be found. Average hours worked per full-time employee are rising for both men and women.

In a normal cycle, this is where we first see the pickup. Only later would you expect to see employment growth. It’s a bit less clear this time, as we’ve already seen an ongoing increase in part-time employment (and an ongoing drop in full-time employment).
After taking population growth into account, the labour market has been soft since early 2012, and remains so.
For now, my faith is with the bullish that appears in the hours worked data — it fits with the evident pickup in the timely (business and consumer) survey data. It is important, however, that this shows up in jobs growth — without that, the RBA will resume cutting their policy rate in 2014.

Welcome back Ricardo.
Have you seen this post by Matt Cowgill, which argues the falling part rate is due to population ageing:http://mattcowgill.wordpress.com/2013/10/06/statistics-at-the-mercy-of-a-slanted-interpretation/#more-1594
Had not seen that post, but have seen the argument a few ways. The timing story is basically that the wealth effect is allowing them to drop out.
you would have if you read Around the Traps!!
Welcome back as well. More posts please
Delighted to see you back – your analysis has been missed.
Very kind. I enjoy blogging … It is just time consuming and there are many demands.
Around the Traps>/a< is out and just for my mate in the General section thsre is a debate on Lod keynesian ad New Keynesian models sparked by Cochrane.
sorry about that gentlemen but it does get you there!