
When thinking about Australia and the outlook for policy, I find it hard to get past the below chart. It compares the growth rate of household gross domestic income to household consumption expenditure (both nominal YoY). When the black line is above the red line, consumption is growing more quickly than income, so the savings rate is falling.
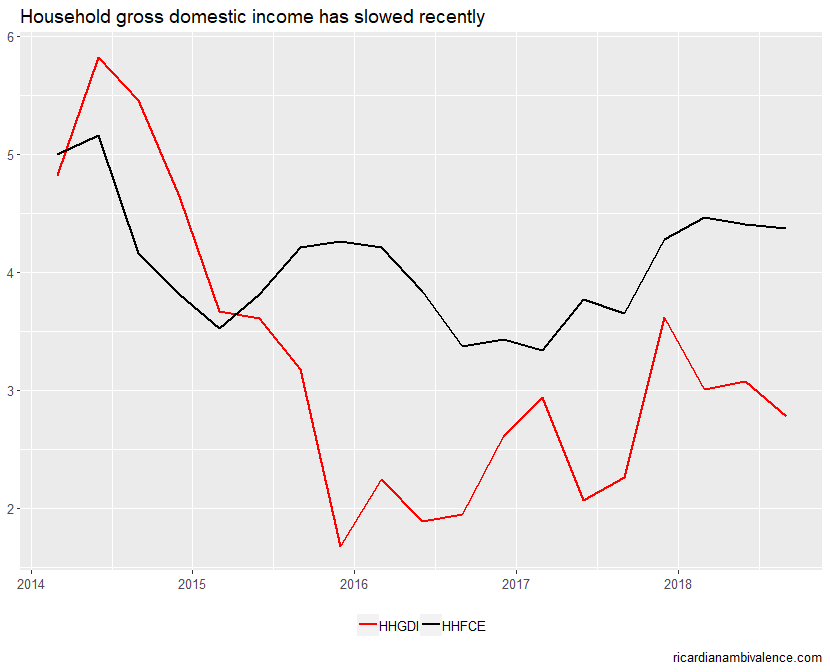
Right now the household saving ratio is ~2.5%, down from ~8.5% four years ago. So Australian households have been running the savings rate down by ~150bps per year for the past four years. Households have been on a savings diet — and who needed to save cash money anyway? It is hard, and boring, and if you owned a home then capital gains from housing did the hard stuff for you.
With house prices now falling ~1% per month, the capital gains alternative has come to an end. The savings rate can go negative, but it doesn’t go much below zero. So at a maximum there’s another year or two in this — but it is probably over, falling wealth (house prices) ought to make folks a bit more prudent.
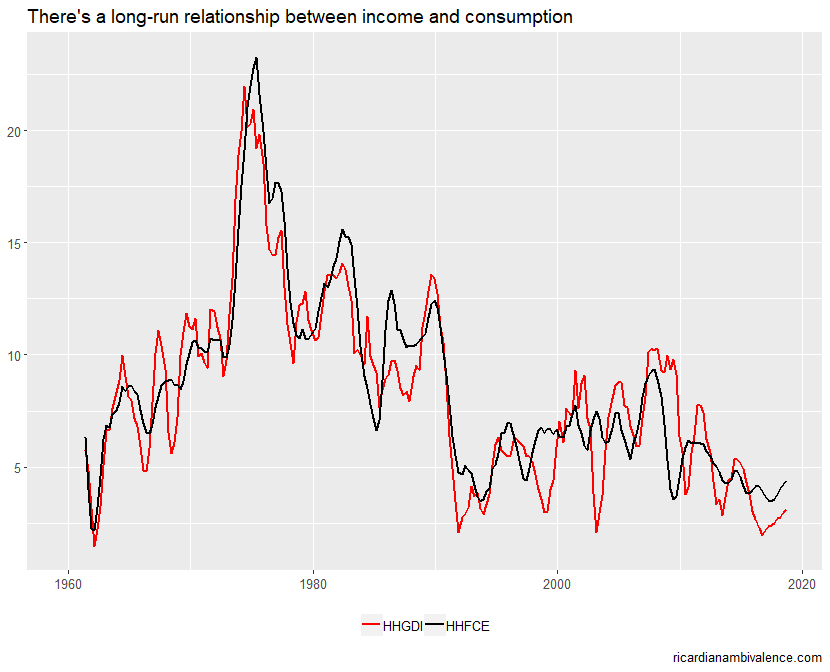
There is a clear long run relationship: so you should not expect household consumption to run too far ahead of income growth over any period of time. The chart below shows the long run relationship between the two series (I use an annual average growth rate to smooth the two series, hence the small difference between the first and second charts).
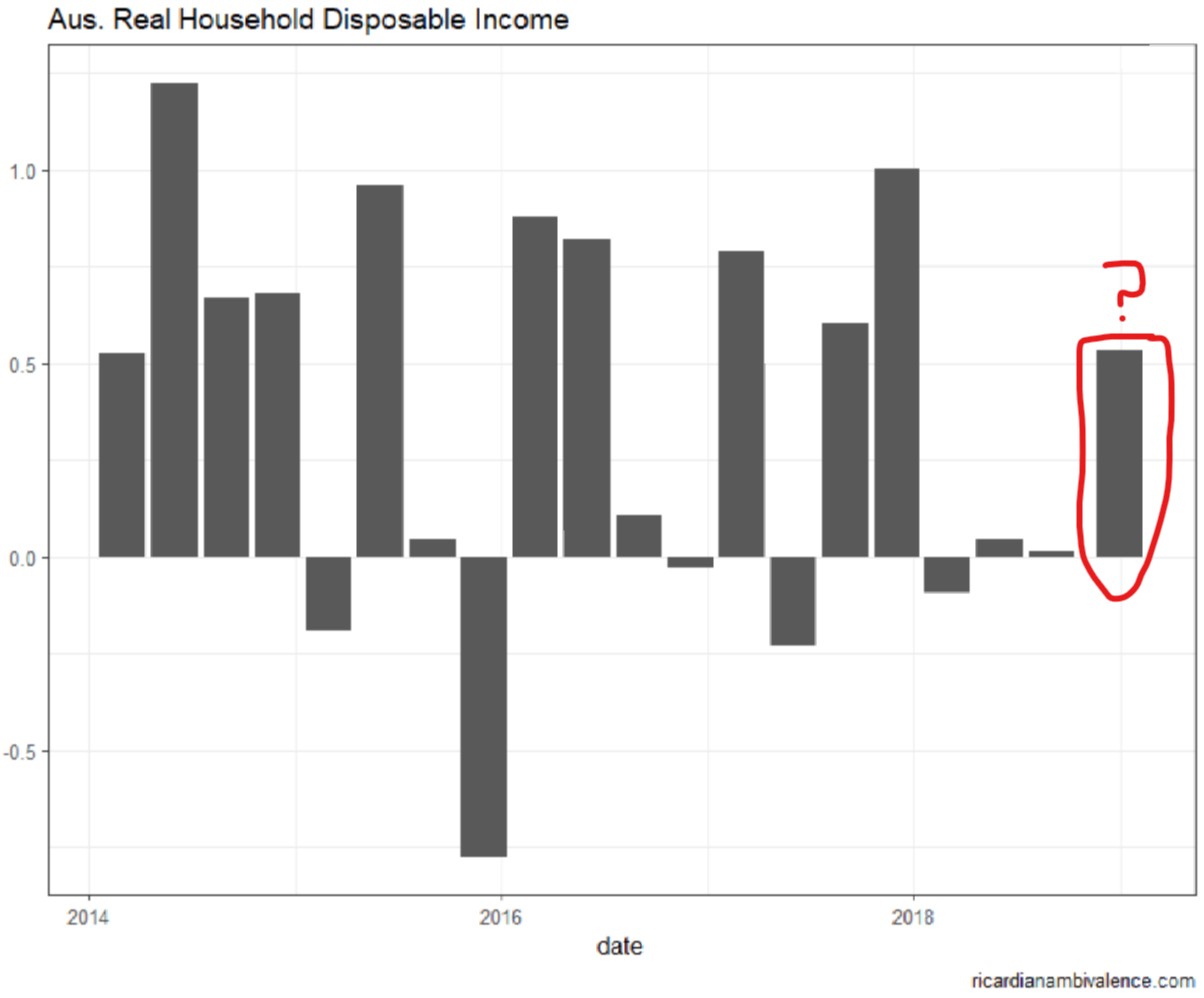
Given the scale of this distressing gap, I think that the household income component of the upcoming GDP report is probably the most important thing to watch.
The RBA’s new table of forecasts tells us that they expect 0.5%y/y for Real Household disposable income (note that the above charts have been nominal). That requires 0.5%q/q. That may sound low, but as the prior three quarters have been basically flat, it’ll be the best quarter since Q4’17.

great article but you neglected the elephant in the room wages growth or lack thereof.
I considered the broadest measure of household income — so i figures that was at least implicitly covered.
Thanks, interesting data and post. A layperson’s question, but what mainly accounts for the difference between nominal household disposable income and nominal GDP (which has of course been growing faster)? I’m guessing the former is more directly driven by nominal wages, hours worked and taxes/transfers? Does the former also include dividends, rents and interest received by households?
To the extent that the RBA responds to falling household consumption by easing monetary policy, that would presumably lower the savings ratio further and further widen the gap between rates of consumption and income growth. I don’t believe monetary policy has suddenly stopped working, so at some point, household income growth will have to rise. What do you think?
Well nominal gdp is everything and the household measure i am using could be expressed as a ratio to show their share of nominal gdp.
I don’t think that’s necessary. As you’ve shown before, the issue for consumption is that much of the mining profits in NGDP go offshore and we may not get as much recycled into investment as before. I’ll be watching the Westpac-MI consumer confidence to see how hinges are tracking.
A manufacturing led export and investment boom would be helpful—but hard to generate
Oh and your second question: yes the consumption ratio is typically pro-cyclical. So cutting should lower the savings rate. The hope is for other channels to operate (fx depreciation in particular) and for this to boost income and savings together. An export driven investment boom would be ideal. It worked last cycle.