
The capex report is one of the more complex reports that the ABS releases – and also one of the more important for monetary policy.
It is complex, because it contains three separate (but related) bits of information; it is important, as it is one of the few reports that tells us much about the demand outlook over a policy-relevant period of time (the RBA cannot do much about current demand, but they can move demand in 1yr to 2yrs hence). Getting it right, quickly, is hard — as you need to thread the three bits together and then cross reference with your best guess about RBA expectations.

You can get an impression of how challenging this from the way the AUDUSD traded around the release of the data — down about 25pips to ~1.02 as the FX market reacted to the headline disappointment of weaker than expected investment in Q4’12, and then up to 1.027 as folks realised that the 2013-14 intentions were more than sufficient to compensate.

So how should we look at this survey? As usual, the RBA has told us what they think works best. In this Bulletin article, they find that a regression approach is superior to the 5yr average that many use to adjust the data.
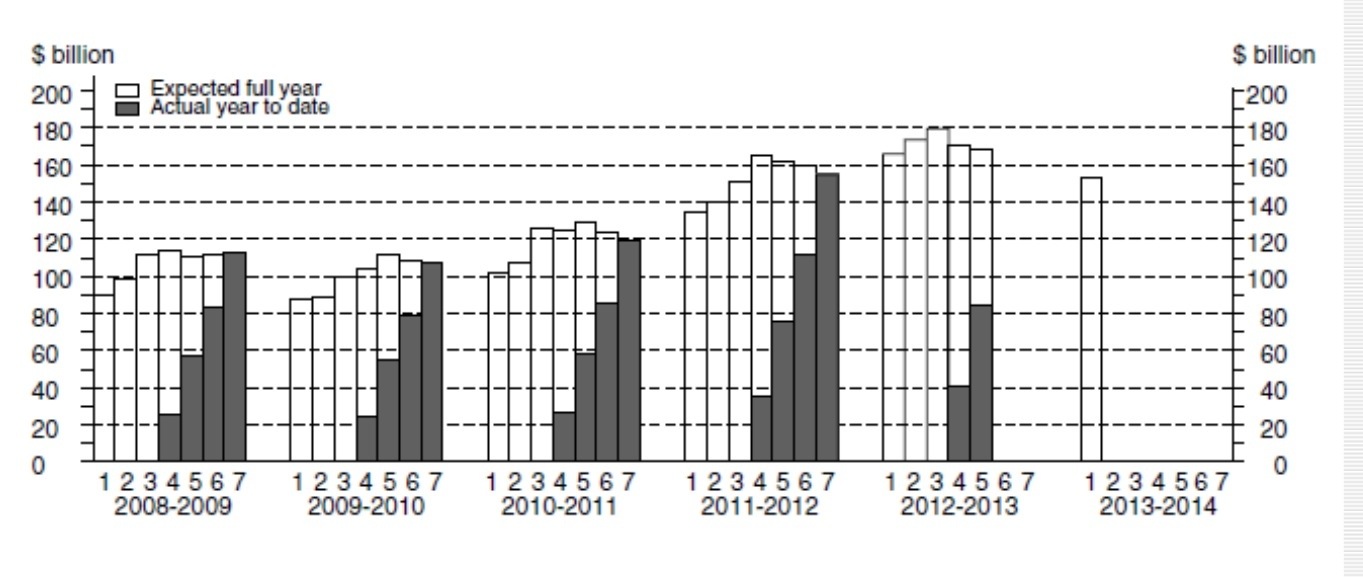
Using 5yr average realisation ratios, you would conclude that nominal mining investment was going to grow by ~13%yoy in both 2012-13 (down from +17% in the prior estimate) and 2013-14; that manufacturing investment was going to collapse ~30%yoy in 2012-13 (down from -17% in the prior estimate), and then slump a further 2%yoy in 2013-14; and that ‘other’ would droop ~5%yoy in 2012-13 (unchanged from -5% in the prior estimate) but then grow by ~12%yoy in 2013-14. Summing across sectors, this suggests total nominal capex growth of ~6%yoy in 2012-13 (down from ~11%) and ~14%yoy in 2013-14.
I think that these conclusions are likely to prove too optimistic. A rough approximation of the RBA’s method suggests that investment is likely to be flat overall in 2013-14. The downward revision to 2012-13 plans has lowered the base by a small amount, and investment is normally a bit higher than the first estimate, so a regression adjusted capex number for 2013-14 will be around like flat in yoy growth terms. This would be equivalent to ~8% of GDP, which is a small improvement relative to my best guess of what Gov Kent’s chart implied.

There are probably downside risks around this estimate. One ought to put some weight on the business surveys, and anecdotes about layoffs in the engineering sector. Also, while ‘other’ is expected to pick up next year (suggesting that rate cuts are working), manufacturing is in a terrible slump (suggesting that the level of the currency continues to hurt). Finally, mining investment apparently remaining (basically) aloft means that we still have the end of the boom to get through.
Who knows, maybe we have mining boom three on the way? I doubt it, but it is possible…
Absent that (or a big drop in the AUD) I remain convinced that the next move in rates is down — but with the investment plunge now looking more like a plateau, those cuts are going back over the horizon, along with the plunge at the end of the mining boom.
The surest call just now is for a long period of stable rates. I think that ends with rate cuts as the investment plateau turns to plunge — but no one’s long dated forecasts are worth much, and it is hard to get clarity of the timing of this given the recent investment intentions survey (not to mention the bullish price action in spot iron ore markets which are up~70% from the Sep’12 low).


Wow it looks like Chris Joye’s views have once again been validated. The RBA and RA appear to have been far too negative on capex. I am just glad I get to read his alternative perspectives at http://afr.com/Blogs/christopher_joye
Perhaps he called all the corporates before the ABS?
You are on fire.
Great article here http://afr.com/f/free/markets/market_wrap/mirage_or_arbitrage_Fk3Gdl5SgJf6UxXsoRcCnO
The three articles on capex are fantastic for those people who wish to know about ‘how the economy’ works (and for people who know it!)
To my mind this is why this blog is a goldmine