
I’ve been trying to find the time to write about that February jobs report. Trying, because this was an important report and a full run through what’s going on takes some time.
Most would have heard two things about the report — probably from Peter Martin — that the report was biased up by population growth and a technical issue to do with sample rotation. In this post, I’ll try to show what these issues amount to.

The headline facts are (by now) well-known — the household survey reported that employment increased by an eye-popping 71.5k in February, thanks to a 17.8k increase in full-time employment and a 53.6k increase in part-time employment. This was the largest monthly increase in employment since July 2000 (+82.9k), due to the fact that there was a decent contribution from both full-time and part-time employment.
Like the Olympics, we ought to expect ‘records’ every four years or so — as a larger population inflates ‘thousands of jobs’ monthly results. Additionally, population growth these last two months has accelerated to ~0.2%m/m from ~0.13%m/m, so we must also control for that when thinking about the labour market.
Full-time employment growth was ~0.2%m/m and part-time growth was ~1.5%, making for total employment growth of ~0.6%m/m.

The change in the proportion of the population engaged in the employment removes the population’s level and growth and scales for the respective shares of part time and full time — the above chart shows the change in the proportion of the population engaged in either type of employment (full-time or part-time).
In these terms February was still a pretty good month, and still a near term record: full-time employment held about steady as a share of the population, while part-time engagement rose by ~0.25%, taking employment as a share of the population up by ~0.25%. That’s pretty good — not awesome, but still pretty good.
The reason we need to be careful about such things is that the employment survey is a household survey — not an establishment survey like the US non-farm payrolls survey.
The survey unit is a physical abode, and the responses are then scaled up according to population benchmarks. If the population were estimated to be lower or growing more slowly, reported employment growth would have been lower in the month.
Assumed population growth accelerated from ~0.13%m/m to ~0.2%m/m in Q1’13 (who knows what actually happened?!) so if one wishes to compare the jobs-per-month estimates across time, some adjustment must be made. Once these adjustments are made (by looking at things as a share of the population) the data suggests that things are picking up in the part-time sector, but that full-time jobs are about flat.
Now for the sample stuff.
This is trickier to explain: the survey is like a deck of cards, and each month we take a card off the top and place a new one at the bottom. The new card is now the 8th card (with the 2nd card becoming the top card, the 8th the 7th, and so on) and it stays in the deck for the next seven months. Some months, the card you pull off is very different to the card you add to the bottom; when this occurs the estimate of employment may change sharply. This is what happened in February.
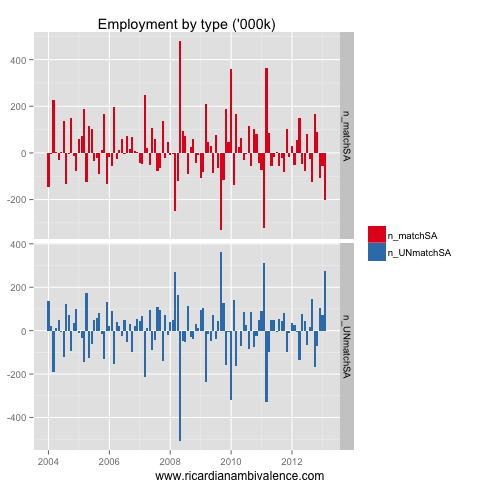
Looking at the gross flows data, we can track those who remained in the survey (in terms of the above example, the 2nd to 8th cards) — the residual is therefore (with some quibbles) the new sample (or the ‘new card’ in terms of our example).
Now we can split this to see what came from the old sample, and what came from the new sample: to frame this in terms of the SA’d numbed we see discussed, I’ve made the assumption that the seasonal factors for the total sample are the same — which is certainly wrong, but probably not too wrong.
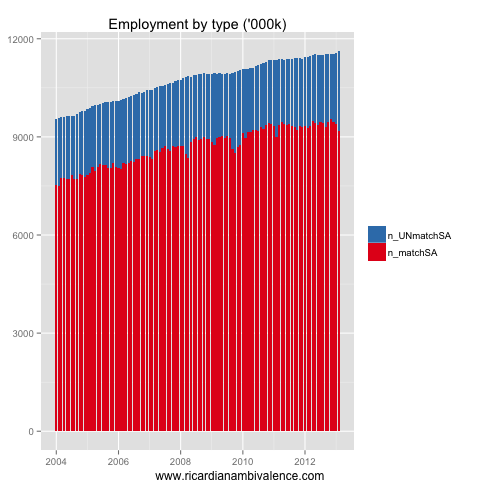
Looking at the above chart, you can see that sample rotation has been a part of the recent improvement in employment estimates. Indeed, the unmatched part of the sample explains all of the employment growth over the past three months. The matched sample has reported job shedding.
My (roughly seasonally adjusted) matched sample employment estimate has declined by ~367k to 9180k over since the November peak, while unmatched employment has risen by 451k to 2448k, for a net gain of 84k jobs (which is the total SA’d gain over those three months — showing that my rough seasonal adjustment isn’t too far off!).
So what’s the truth about the labour market? Is it adding jobs (as the unmatched sample suggests) or losing jobs (as the matched sample suggests)?
Who knows, the survey isn’t designed to measure the number of jobs. What it’s designed to measure is the unemployment rate. It does a pretty good job of that.
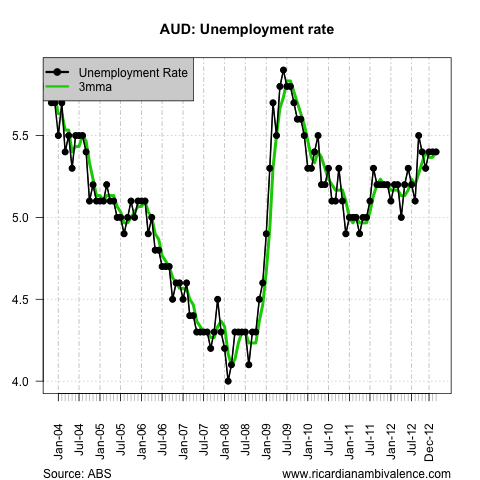
According to the ABS, the unemployment rate been stable at ~5.4% for some time, which is better than most expected: most expect that it would have kept rising. It is, however, not so great given that the headline number hides a multitude of sins.
More on these later …

4 comments
Comments are closed.