

RBA Gov Lowe has been trying to hold onto his May SOMP forecasts — but the data keeps softening … and just as the WPI data broke their NAIRU base-case, the retail and vacancy data challenges their conclusions about the wealth effect and the usefulness of the ABS Vacancy data.
A third quarter of weak retail sales is strong evidence of a housing wealth effect; and it’s pretty clear that the quarterly ABS vacancy series seriously lags the alternative monthly releases (ANZ, SEEK, DEEWR).
First of all, consider retail. The May retail release gives us enough information to make a pretty good stab at Q2 real retail sales. I estimate that June quarter retail sales will be ~0.4%q/q in nominal terms — made up of a ~20bps increase in nominal food sales and a ~20bps increase in non-food sales. This will make it the weakest nominal quarter since Q3’17.
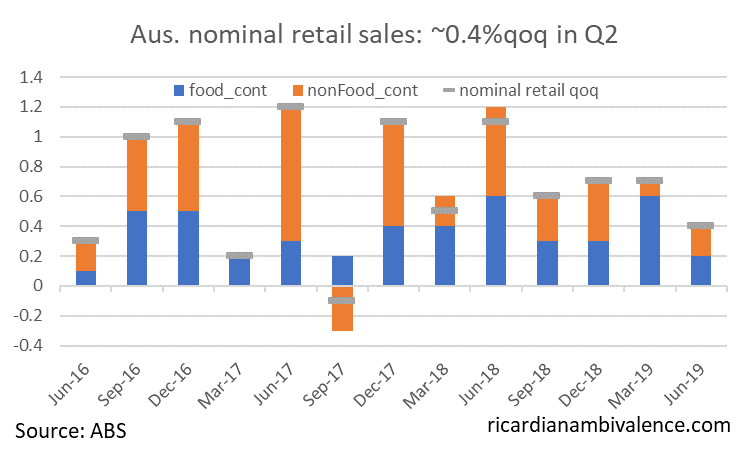
There are upside risks to this, as there were positive anecdotes following the election — but at maximum it’ll be a 0.6%qoq nominal print.
The retail deflator has been running around this level, so it’s very likely we have another flat quarter for real retail sales. I’m going for 0.5%qoq for the retail deflator, which will mean real retail sales will decline by 10bps. If there’s a June surge and we end up with +0.6%q/q for nominal, a 50bps deflator will deliver a +10bps increase of real retail sales.
Either way, it’s weak.
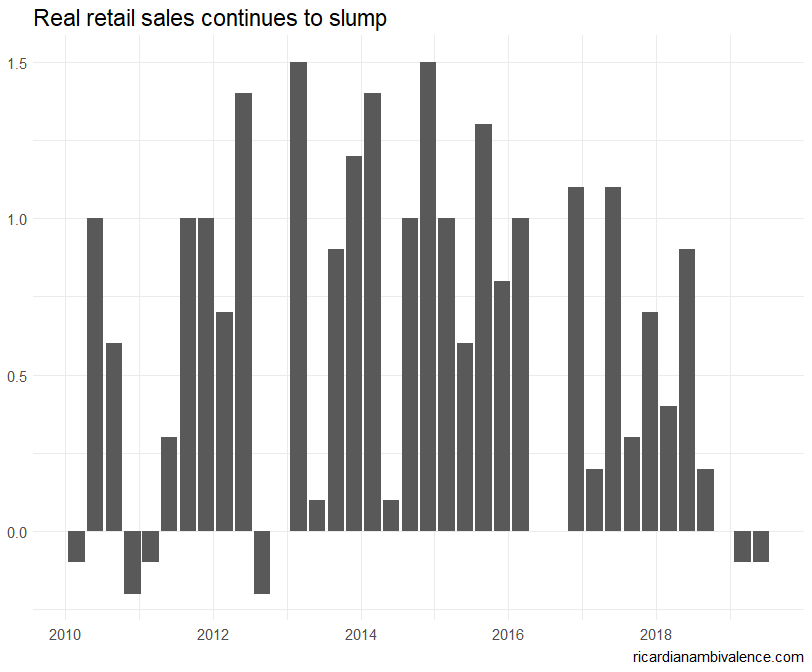
So that’ll be three quarters without any growth of real retail sales — despite a ‘strong’ labour market … what’s going on? Perhaps it’s a wealth effect?
And it’s hard to get strong GDP without strong retail sales. So it looks like we’ll get another GDP print in the 0.25%q/q to 0.5%q/q range — which means that GDP will slow to ~1.25% to 1.5% on a YoY basis (the RBA has ~1.75%). The RBA might not fess up to this in the August SOMP, but a November rate cut (as they downgrade GDP) seems fairly certain.
Surely Occam’s razor demands they look again at their housing -> consumption models? Other central banks, notably the RBNZ, have reached conclusions that better fit the Australian data. The RBNZ found that more debt means a more asymmetric relationship — so there’s less boost when house prices rise and more damage when they fall. Seems to fit.
The other thing that the RBA has been relying on is the strength in the ABS measure of job vacancies. Today’s release shows a 1.1%q/q decline of job vacancies — driven by a 1.6% decline of private sector vacancies (public sector were up ~4%).
Their preferred way of looking at this data is as a ratio to the labour force: on this basis, the vacancy ratio fell a little.
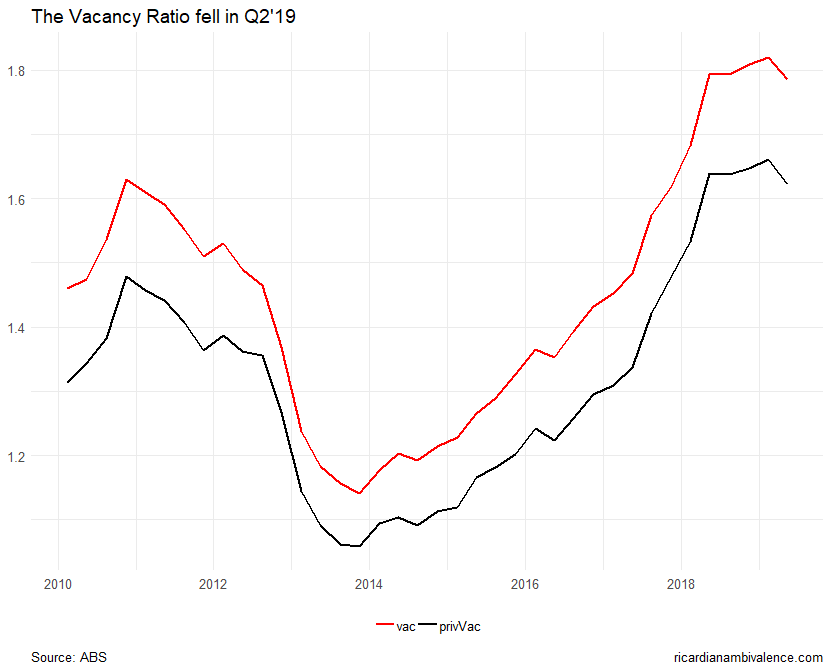
All this was obvious from the more timely data on vacancies — the ANZ, SEEK, and DEWR measures of labour demand all turned down some time ago. I suspect the reason is that firms will pull the advertisement before they tell the ABS there’s no longer a vacancy — after all, ads cost money … and if the right person were to walk in the door they may well hire them.
Acknowledging they were wrong on the wealth effect, and focusing on leading data would make for better policy. I hope the RBA’s not too proud.

This plays in with the does the phillips curve work anymore. We have had macomania, your mate and now David Glasner write about it.
Very perplexing for central banks
Clearly doesn’t… exist any longer. Unclear why. I did a little animation showing the collapse a while back