
Following on from the post on how re-distributive the Swan Treasury has been, I figured I’d take a look at the evolution of Commonwealth Treasury forecasts for Receipts and Payments (the data are collected from budget paper 1, statement 10 of the various budgets and appendix D of the 2012-13 MYEFO — this is a link to statement 10 in the 2012-13 budget, and this is a link to Appendix D in the 12-13 MYEFO).
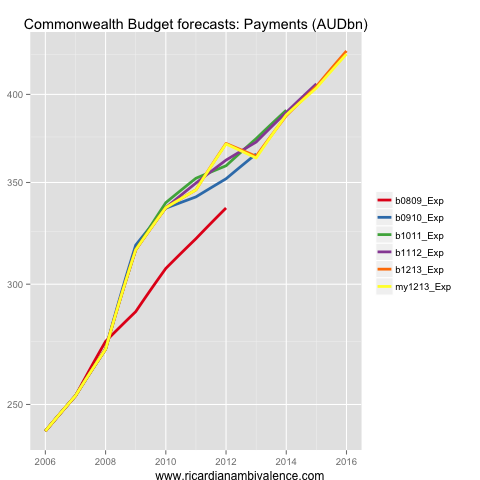
So what’s been happening with expenditures? The above plot shows budget expenditures (AUDbn), with projections coloured according to the document in which they were published. You can see the expenditure bulge in 2008-09 (the ‘stimulus’), and the bring forward of spending into 2011-12. The latter seems like a bit of a joke now, as the goal was to reduce spending in the 2012-13 period, in an attempt to magic-up a surplus. What catches my eye is that spending in nominal terms rose sharply in 2008-09, and still has not returned to the prior trend.
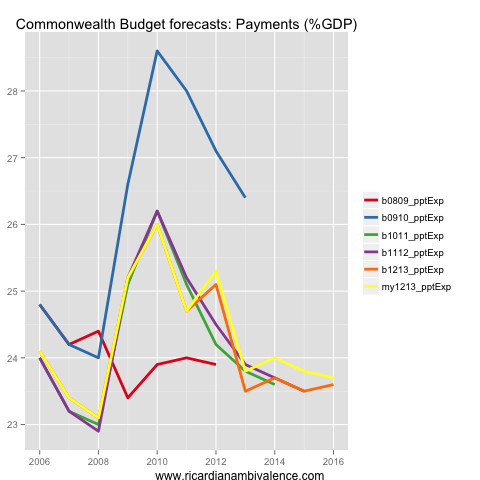
As a proportion of GDP the story is not quite as stark — but you can still see the spending bulge. At 25.3% of GDP, payments in 2011-12 remained well above the ~24% (or so) level which is probably consistent with a balanced budget, however in part this was due to pulling payments into that year (and out of 2012-13).
The projection has been for payments to track back down below 24% over time, which is probably required to get the budget back into surplus — but actually achieving it is more difficult than projecting it (note: the budget 2009-10 Expenditure %GDP line is correct — the forecasts at the time were for a deep recession, so the ratio of expenditure to GDP was inflated).
On the revenue side, things have generally been better than feared in 2009-10, but not as good as hoped in 2010-11.
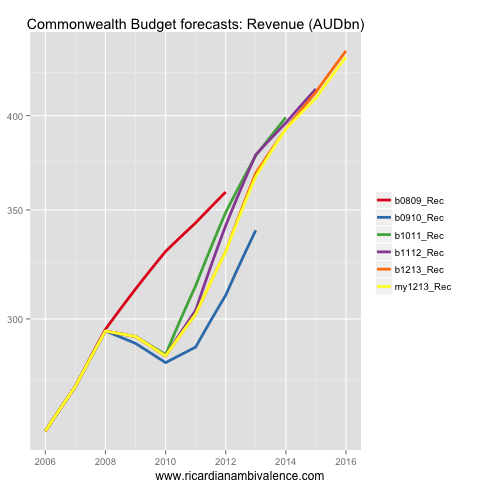
The monthly returns suggest there have been further downgrades here, so the next line will be a shade lower again.
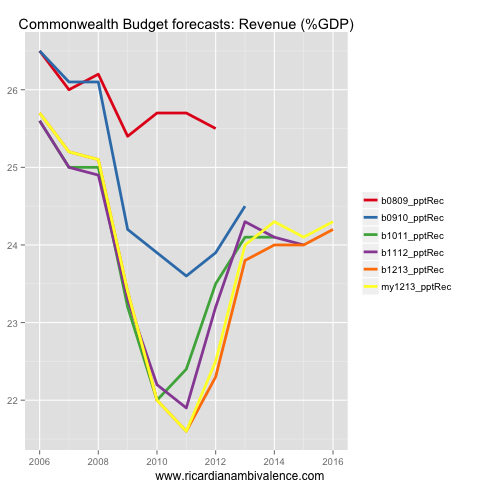
As a share of GDP, receipts are particularly depressed. This is partly about the high AUD and partly about the decline in the terms of trade — which are working together to lower nominal GDP growth and hence tax receipts. This stuff is hard to forecast, but I do not think it is the surprise some are claiming.

This is something Treasury were warning about back in 2010 — that after taking out the terms of trade, the budget was in structural deficit, and would remain so for some time. The tide is going out, and it is exposing a structural deficit that has been there since the late Howard / Costello years, and that Rudd / Swan have made worse.

Another reason for NGDP targeting. Hockey should really think about it. The tone of recent political commentary has all been about how much worse things will get when the ToT falls and the mining boom ends. It need not be that way if the RBA does what it did post the Asian crisis and keep nominal growth on track. If it doesn’t, as it hasn’t to date, austerity is/will get a bad name when the real issue is nominal (pun intended). Spending on dependency-inducing entitlements and programs can and should be cut substantially, especially in the first term of a Coalition Government.
“Spending on dependency-inducing entitlements”
100% agreed. But across all levels of income. Like 15% super concession, negative gearing, etc. Means testing levels could also be reduced. They seem to think that you need assistance if you are on 150k !
Beside the high AUD and ToT falling (both not hard to forecast really), I think falling revenue as a % of GDP may also be due to a low nominal GDP and peculiar GDP composition.
Mining development needs high investment in the start-up phase, but in the production phase expenses should be lower and earnings much higher (if commodities prices do not fall) and govt receipts should get higher again.
Overall, however, I think it’s obvious that Australia is and will be much dependent on commodity prices and since those are hard to forecast, govt better make conservative projections and if things are better than forecast well that money can be deployed later on.
Govt must take the lead role of providing a cushion, a buffer to try to protect the economy from the ups and downs of the commodity cycle. Spending money you do not even have pocketed yet is not the right approach. Better be frugal.
News just in: “Abbott defends company tax hike”!
http://www.businessspectator.com.au/news/2013/4/23/election/abbott-defends-company-tax-hike
So, no mining tax, but a higher company tax rate?
I thought we were going to *lower* the corporate rate to be more competitive internationally.
RA,
This is disappointing,
The reason for the structural weakness is main;y Rudd/Swan but is revenues.
WHO was the clown who cut income tax in the expectation of company tax ever expanding?
Moreover we would be in balance IF nominal GDP was growing at trend.
you wanted spending to be cut more.
Just when did you want this contractionary policy?
as i said previously the time to either cut spending more,increase taxes or a combination of both is when the economy is growing reasonably strongly.
Please relate these comments to the facts in the post … All the data comes from the Cth treasury. There was a clear spending bulge. Revenue / NGDP weakness is only a part of the story.
really but tax as a % of GDP is at Keating levels.
As I said this is dissappointing. you cannot even look at graphs properly!
As an aside before the GFC hit Ireland had a structural deficit of around 0.5% . when it hit it rose dramatically to over 5% without any stimulus at all.
Why do you think that occurred?
It is related!!
I think I will call this the Cochrane effect!!
I do say that revenues are ‘particularly depressed’ …
My broad point is that we had a cyclical boost to revenues due to the terms of trade, and that both sides spent it. Partly in tax cuts, and partly in outlays. That is our problem.
Now we have a structural deficit.
This was seen years back, by treasury. Clearly they were ignored – and the politicians stuffed up the implementation of their revenue raising ideas!
It’s interesting to note that the increased spending, as % of GDP, since 2008 (it used to be 24%), has done nothing to stimulate revenues so far.
From the appendix:
Year – Revenues % – Spending %
2008-09 – 23.4 – 25.2
2009-10 – 22.0 – 26.0
2010-11 – 21.6 – 24.7
2011-12 – 22.5 – 25.3
And the estimate for 2012-2013 were very optimistic indeed!
2012-13(e) – 24.0 – 23.8
Govt can keep spending and hope that revenues will come back up, in a European pre-GFC style, but I think lower revenues may be structural, related to lower credit growth and higher saving propensity – and a higher dollar.
How can you say that that there was boost to revenues from Commodity boom 2 when it didn’t happen in tax revenues.
That is when we see the structural problem in revenues NOT spending.
If it occurred in spending then we would see it it boosting GDP, which we do not!
I am again disappointed.
Perhaps you ought to read the treasury note i linked to… Their method is to adjust for the terms of trade. I think it is an okay adjustment.
Silly naive question…can revenue spending be expressed as a percentage of the population? and does this provide a simpler way of comparing changes in the two over time. Because ultimately isn’t spending / revenue per head of population the main game? How much is being spent on the population and how much is being raised by it. Wouldn’t this be a simpler denominator than GDP which, in my opinion is 40% made up.
Pop ests have issues as well.
Debates about GDP aside why don’t we see population used as a denominator? Seems more logical to me.
Because the budget constraint is money.
lol not as many as GDP…the number of adjustments, imputations and modelled outputs that feed into the SNA far out ways any population estimates for australia…and i’m talking about the final gdp figures not the extremely flaky qrtly ones. I can’t think of any of the 3 inputs of population that are completely made up but there are many many that feed into the SNA. Births, Deaths and migration are pretty well covered.
plus all the data for population are administrative data sources…not the survey crap that acts as the major input into gdp