
There was some confusion about core CPI yesterday, thanks to the divergence between trimmed mean CPI & weighted median CPI . This is not surprising as they are fairly esoteric concepts. The bottom line is that the trimmed mean is the best measure of inflation — as it preserves a lot more information about the distribution of inflation, but still cuts out a lot of the noise.
This is most easily described with the help of a chart. The below chart shows the distribution of QoQ CPI changes. The blue line is the weighted median, and the green line is the trimmed mean.
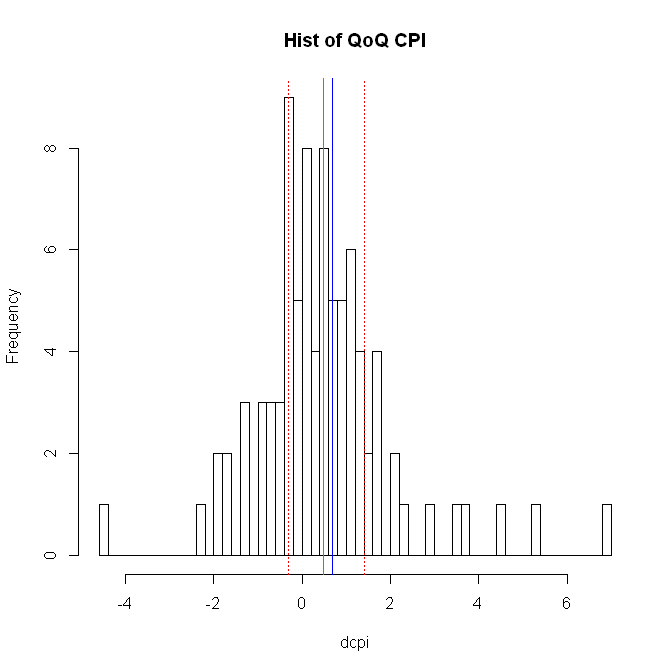
These are not weighted by how important each of the 87 expenditure categories are — but most folks agree that is an important next step. Say we want to cut out some noise — how much do we cut out? Do we cut it all out and just take the thing in the middle (the weighted median) or do we just cut out the outliers (the trimmed mean)?
The Blue line is what we have left if we look at the weights and cut out 86 of the 87 spending categories, and are just left with the expenditure category that’s in the middle (could be Bread one qtr, fuel the next, and vets the quarter after that). The green line is what we have if we just cut out the 15% of weighted spending categories at the top and bottom (the bits outside the red lines), and take the weighted average.
So which is best?
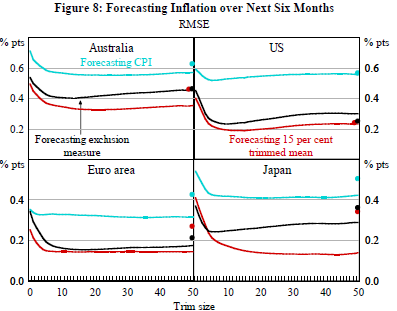
The RBA has looked at this question, and it’s found that the trim is the best quide if you want to forecast CPI. That means that if you want to forecast future inflation, the best guide is current trimmed mean CPI (in these charts you want the line to be as low as possible).
The RBA went with the 15% trim (slicing 15% from either side) as it performed best — the 50% trim, of course, is the same thing as the weighted median.
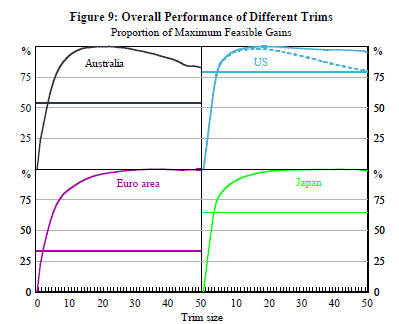
Another way of looking at this is the above chart — in this chart, you want the line to be as high as possible. The performance of the core measure peaks ~15% for Australian CPI, and starts falling steadily ~30% for the trim. There’s a notable loss of performance by the time we reach the weighted median (of ~50%).
This is why I focus on the trimmed mean, and not the weighted median.
I don’t know why the ABS even publishes the weighted median — it just confuses the issue. The weighted median is a case of cutting too much of the signal in an attempt to avoid the noise…
On this basis, the situation in Australian inflation is clear — the best measure shows that inflation has been running below 2% AR for the last two quarters. The RBA’s job is to hit 2.5%, so they are failing. They must cut rates.
With the unemployment rate trending up, it’s unlikely we’ve seen the low print for CPI — which means it’s unlikely that this is going to be the last rate cut. It might be if the AUD drops another 10c, but I do not think that’s likely (Fed-Taper is mostly already in the price of FX).

This is one of the best examples of how the blogosphere works well.
Our good friend has explained a key concept well and why it is important.
Excellent material well into the Krugman, Wren-Lewis class!!
Very kind, thanks.
You have inpired to write THIS!!
I do hope more people read this as well as all your articles. Better education for all of us!
whoopsy that is meant to say inspired me to write.
Damn
Hey, what about “core” inflation in the sense of removing only food and energy, like it’s done in the US? The RBA seems to publish it on this page: http://www.rba.gov.au/inflation/measures-cpi.html – if I am not mistaken. They call it “Excluding volatile items” I think.
For me it looks like the best measure and it clearly shows the “carbon” impact. On this measure, next quarter the impact of the carbon tax will be gone on the y/y and they’ll be missing their inflation target quite significantly.
Do you know more about this “Excluding volatile items” and why it’s not talked about more extensively like in the US? thanks
The rba charts i snapped include such core measures – they are less useful — correction no they do not … Those charts didn’t make the final cut — you can find them in the RBA pub … It is less powerful than TM.
thank you
Yes,
It is like our mate says, The RBA was not happy with the various series of the CPI so they came up with their own.
I am old enough to remember having to wait until the RBA put up the numbers on their website for the trimmed mean and weighted median.
you will find that in the US more and more people examine the Cleveland figures.
for example Bill McBride at calculated risk always had the cleveland figures plus core each month just as we SHOULD!
Hi nottrampis, the RBA publishes 4 measures :)
All groups – Excluding volatile items – Weighted median – Trimmed mean
Any more info on “Excluding volatile items”? I guess it must remove energy and food, like the US core? IMO “Excluding volatile items” seems to be quite good in predicting what the RBA next move will be.
Thanks Ricardo. Does this mean that the ‘trimmed mean’ is actually a ‘trimmed weighted mean’ or a ‘weighted trimmed mean’ or even a ‘weighted trimmed weighted mean’? I think I always found it confusing that the weighted median was weighted but the trimmed mean didn’t say anything about weighting. What you say suggests that the trimming is weighted (so if a highly-weighted item is an outlier at one end, relatively few other outlier items from that end will be trimmed), as well as the averaging of the remaining (untrimmed) items. Is that right?
When you say you wonder why the ABS publishes the weighted median, isn’t it in part because the RBA’s measure of core is the average of the trimmed mean and weighted median?
Yes, the trim is weighted. Both in how it is trimmed and that it’s a weighted ave of what is left after trimming.
The charts show that the rba thinks on average that the WM is less powerful than the TM. From time to time you are interested in the WM, but really the TM is whatnyou want if you are interested in current and prospective inflation.
Rajat you naughty you. RA has provided the link. read it!!!
Comparative advantage!
ricardo ,comparative advantage, very good!