

The July jobs report was hard to read. The incentives created by COVID, lockdowns and government support meant that it was hard to get a clean read on the data.
I typically tell people to focus on the unemployment rate, as that’s what the survey does best … but that doesn’t work this month (even the matched sample rate is messed up).
In any case, we know that the survey was too early (it’s early July, so it caught the start of the NSW lockdown) and that longer lockdowns are associated with greater the job loss (if for no other reason that jobs end every month, and that matching people with new jobs is harder during a lockdown).
The key question for markets is if there is a role for monetary policy. That basically comes down to what’s happening in the NSW labour market. Are firms holding onto workers, or are they letting them go?
The gross flows data shows that firms are letting workers go. There’s something nasty and different happening in NSW.
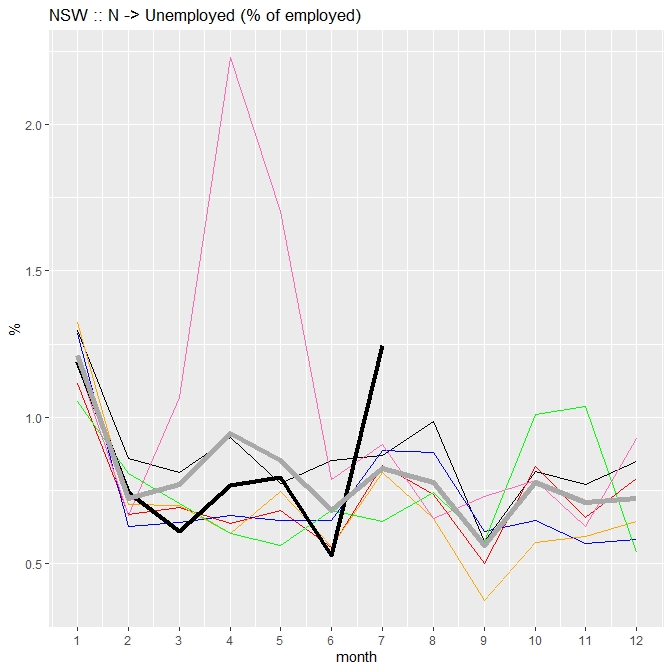
The chart below shows the percentage of those that were employed in June that transitioned to unemployed in July, for the state of NSW. You can see the percentage spiked to ~1.25%, which makes this by far the worst July in the past seven years. Only the COVID months in 2020 (the hot pink line) were notably worse. Note also that the black line (2021) has gone from below the grey line (grey is the average for 2015 to 2020) to above the grey line. So the NSW labour market has gone from better-than-average to markedly worse labour market conditions.
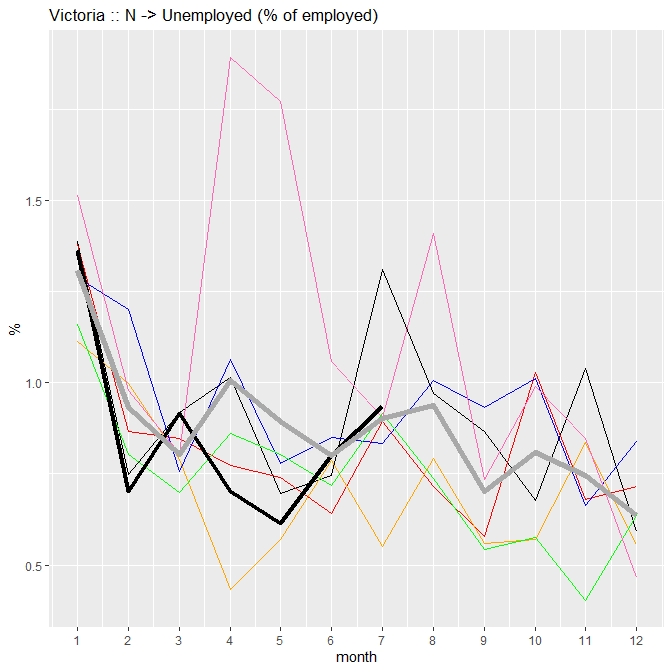
What I find interesting is how different the NSW experience is to what happened in Victoria (in their June lockdown). As you can see below, there was an increase in transitions to unemployment in Victoria, but it was partly seasonal, and it was really only just back to the long run average.
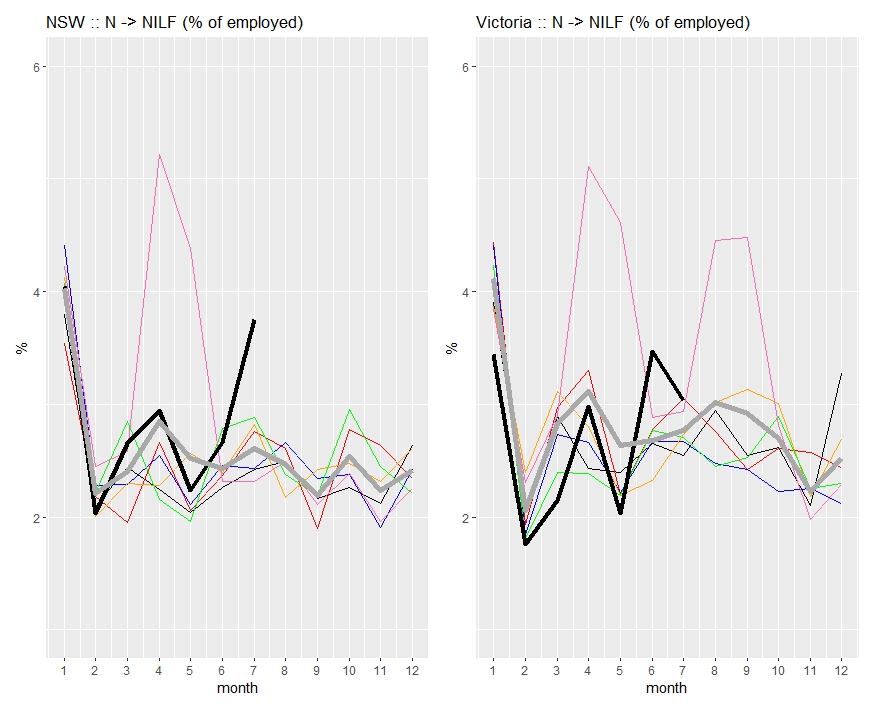
It cannot be dismissed as a difference in the propensity to search for work. The increase in transitions from Employment (N) to Not In the Labour Force (NILF) were similar, if a little higher, in NSW than was the case in the June Victorian lockdown.
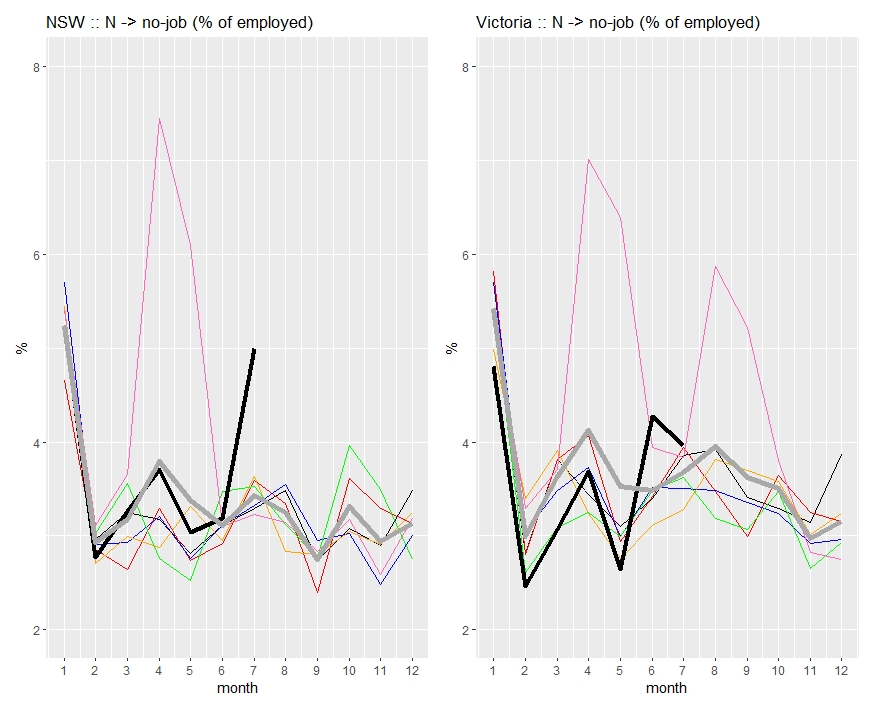
Combining these two transitions, we can see the proportion of people who had a job in June and didn’t have one in July. Again, you can see the spike in NSW, and that it’s different to what was happening in Victoria’s June lockdown. I don’t know why, but there’s something different going on in NSW.
Perhaps NSW was on a fully post-COVID path, so the re-introduction of COVID changed confidence? I live in NSW, and that’s my impression from the folks I know.
It’s not quite as bad as lockdown 1 in Q2’20, but it’s on track to be at least as bad as the second Victorian lockdown. It’s going to take some time for things to go back to how they were in May.
I think that this is very important when considering the role of monetary policy.
This is a health crisis and there’s nothing that monetary policy can do to ‘fix’ the problem. However there is a role for monetary policy in cleaning up the mess. When the health crisis disrupts the relationship between workers and firms, monetary policy can help push them back together. The main channel is probably via a lower Australian dollar — and i’d say that there’s some easing already baked into the AUD. However, if the RBA doesn’t validate easing expectations, it’s going to rally.
Today we learnt that, as expected, the Greater-Sydney lockdown has been extended (at least) until the end of September (taking it to 13 weeks … but it’s probably going into Q4), and that things have been tightened up further (including a curfew!).
The gross flows data shows that the NSW lockdown was already causing elevated disruption in early July. It’s definitely going to get worse in August and September.
This suggests to me that there is a role for monetary policy to play — despite the fact that other Central Banks are leaning toward tapering, and that the RBA’s footprint in the bond market is getting a bit awkward.

One comment
Comments are closed.