If you only know one thing about the labour market report, it is probably that the unemployment rate has been steady at ~5.25% for some time. That’s a pretty good outcome.
Broadly speaking, the development of the labour market over the past few years has been a gender story. Female unemployment has been stable at ~5.5% since the end of the crisis, and male unemployment — after recovering to ~4.5% briefly in ‘mining boom’ phase — has trended up by ~1ppt to ~5.5% since mid 2011 (the period over which the RBA has been cutting rates).
If you know two things about the labour market, the second thing is probably that the ‘experts’ (including the RBA) are saying that the apparently low unemployment rate hides the degree of slack in the labour market.
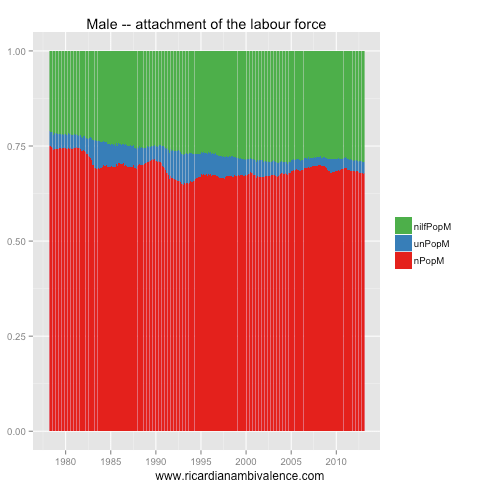
The reason people say this is that there has been a decline in labour force participation. This has mostly been the result of a long term decline in male labour force attachment. Fewer men now participate in the labour force.
This is partly changes on the supply side of the labour market — we look at this below — but i also think that there is a demand-side aspect (that is that folks are leaving the labour force as employment becomes more difficult to obtain).
Looking at male labour force attachment over time, you can see that most of the 2008-9 recession’s impact has been to move men out of the labour force. This has been more-so the case in the post mining-boom (2011+) phase. In the period right after the GFC, men exited employment to unemployment, rather than leaving the labour force entirely.
Something similar occurred following the severe 1991 recession — men exited to unemployment and then left the labour force. It took almost 15yrs to get back to the pre-recession level of employment (measured as a proportion of the population). Partly this is cyclical — Men work in more cyclical sectors (manufacturing and mining) and their human capital is therefore more likely to be damaged by structural change.
Female labour force attachment, by contrast, has been in the midst of a once off boom — women joined the labour force in record numbers over the past 30yrs thanks to a change in social norms. This has delivered a nice boost to household incomes (and government tax reciepts), and has softened the drag from the weakness in the male labour market.
A second household income probably also gave men the option of leaving the labour market to do other things — such as to study and parent — though this likely only accounts for a few percentage points of the drop in the male employment to population rate.
Over the past three decades, the changes in the female labour market were more important (economically) than the male changes. The upshot was a long term increase in participation despite the difficulty men had finding (or retaining) work.
All told, I find the slow exit of men from the labour force in post-recession periods, and the only gradual recovery in employment to population rates suggestive of the conclusion that men find it tough to return to work following recessions.
Consequently, I suspect that part of the low frequency labour market weakness also reflects weakness of demand. That is, if demand were firmer i think it likely that a larger proportion of men would be either in work, or looking for work.
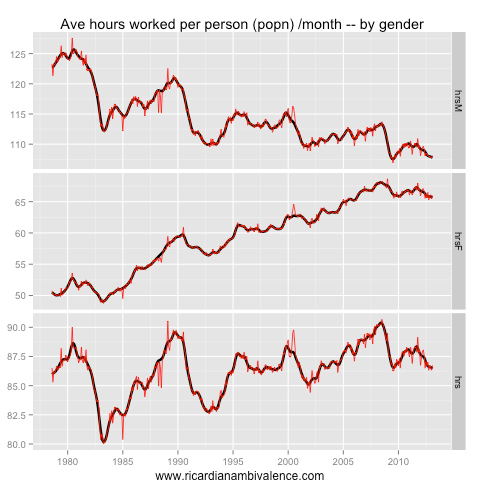
In addition to the long term downtrend in participation, we have seen a long term drop in hours worked. The trend lower probably reflects some supply side changes, however the shorter term cycles almost certainly reflects weakness in demand.
There was a recovery from the GFC, but the recovery was incomplete — and it has now mostly unwound. The average man is working ~159hrs per month in trend terms — this is only ~0.5% above the GFC low, and is ~1% below the post GFC peak. The average woman works ~118 hrs per month (in trend terms), which is ~0.3% below the GFC low. This has pulled total average hours per person down to ~140/month, which is around the GFC low.
Looking at the hours worked per head of population combines these two strands of reasoning. The below chart shows that there has been a long term downtrend in hours per month worked by the average man, and a long term increase in hours worked by the average woman.
Both the crisis and recent soft patch have been felt in both hours worked and employment — with a large drop in both leading to a large decline in average hours worked per head of population.
The GFC caused the average number of hours worked by Australian men to fall from a peak of ~114/month in 2008, to a low of ~107/month in 2009; the recovery took average hours per man back to ~110/month, however the subsequent soft patch has seen hours per man fall back to ~108/month. The story is similar for women, with average hours per month for women falling from a peak of ~68/month in 2008 to a low of ~66/month in 2009; the recovery lifted hours back to ~68/month, however the recent soft patch has driven them back down to ~66/month.
Combining the two and looking at trends, average hours worked per Australian are currently not much different from the depths of the GFC. That is, after adjusting for population growth, there is little difference between the overall use of labour now and in the depths of the GFC. Average hours worked per month are now ~86.5/month in trend terms, which is pretty much where they bottomed in 2009.
In seasonally adjusted terms, average hours for all Australians are nowa little below ~87/month, having fallen from a post GFC peak of ~88/month — which is well shy of the ~91hrs/month peak that was reached in 2008.
While a part of this is likely to reflect a long term trend toward lower employment rates and fewer hours per week, it seems likely that it mostly reflects weak labour demand. This is why the RBA has been cutting rates despite the fact that the unemployment rates has remained fairly low and stable.
If labour demand doesn’t pick up, inflation is likely to remain low — and this will give the RBA scope to cut rates further.


your sparring partner Joye-boy fascinating today in AFR on illiquidity v insolvency. Michael West in SMH also ran something on this on weekend. Read Joye:
http://www.afr.com/p/dangerous_word_games_over_solvency_YDQp30lCiINiHKNrIudcKK
Thanks. I will check it out
Thanks for the analysis. Interesting that hours worked per employee fell so much right after the GST was introduced and marginal income tax rates reduced. Clearly some of this was cyclical but the fall was greater than in the 80s and 90s recessions. One would expect hours worked per employee to rise if MTRs fall. Perhaps employers made use of more flexible IR arrangements to cut hours rather than jobs? And/or perhaps services suffered more than manufacturing in 2001 than in the 80s and 90s due to the low dollar and tech/financial boom unwinding?
Either way, the analysis makes clear that monetary tightening is (or should be) a long way off.
Good pick up about MTRs and the GST.
I agree, you have to think that there has been a lot of supply side change to justify a conclusion other than that labour utilisation is slack.
Is a falling participation rate “stagflationary” ?
Depends on why they left the labour force. It could be.
PS I think these new avatars we each have are very apposite! How do they do it?
No idea – they claim it is random, but mine is spooky appropriate :)
Mine is not too good… I would prefer a smiley one and not pink :)
But maybe the “CLOUD” knows more about myself than I do!!! ah ah