Lowe’s watershed speech
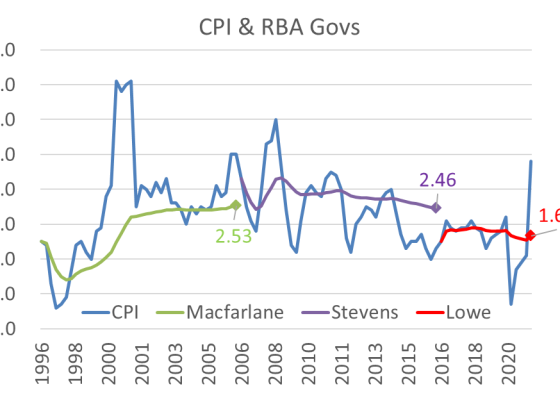
The 2021 Anika speech was used to deliver three key messages to the market: 1/ The outlook for QE is further tapering. 2/ They need CPI near 2.5% before hiking. 3/ The market is wrong in pricing rate hikes in 2022 & 2023.
macro, politics, markets, ambivalence

The 2021 Anika speech was used to deliver three key messages to the market: 1/ The outlook for QE is further tapering. 2/ They need CPI near 2.5% before hiking. 3/ The market is wrong in pricing rate hikes in 2022 & 2023.

A recent bias to shorter bonds means that the risk (DV01) extracted by the RBA’s buybacks has declined. Combined with the tapering of the amount, this lowers risk extracted by about 30% per week.

The weekly 6-day jobs series is now available up to the week ending 29-August. It suggests little damage from Delta, clearing the path for an RBNZ hike on 6 Oct.
The RBA today made November’s decision and pre-committed to buying at a 4bn pace until at least February 2022. The

The RBA meets on 7 Sep. The data was strong in Q2, but the outlook is dimmer due to Delta. Bond market capacity makes faster QE unlikely. The most likely outcome is to pre-commit to buy at 4bn per week until at least Feb’22.

Q2 GDP was +0.7%qoq and 9.6%yoy, to be pretty much bang-on the RBA’s forecast of 9.5%yoy. I said this morning

Q2’21 GDP is going to be weak: say +0.25%qoq. More likely 0%qoq than 0.5%qoq. My tracking estimate of the GDP-expenditure

July retail sales report sets up Q3’21 as the worst ever quarter. It raises fresh questions about on the RBA’s Aug SOMP forecasts. And reminds us what is different about the Q3’21 lockdowns.

Q2 GDP is tracking 40bps below the RBA’s August SOMP forecast. Weekly payrolls suggest job losses in NSW are similar to the first COVID lockdowns.

The weak Q2 CWD release confirms my hunch that housing won’t drive growth any longer. It also shaved about 30bps from my tracking of the RBA’s GDP forecast (now +0.4%qoq).

The RBA can push back the constraints on their Bond Purchase Program by buying beyond May’32 and buying more Semis. Doing both would create scope to ease policy by accelerating QE, if that was required.

There are three main problems with RBA QE: The RBA owns too large a share of the lines it does buy. The tenor of the bonds they buy is shortening. And Semis want to issue longer than the RBA buys to fund infrastructure.
